

Dr.Rakesh Juneja, J15026, Dr. Ahmed Eltayib, Dr.Navneet
Mehrotra, Dr.Manish Nagpal
Introduction:
Optical coherence tomography (OCT), fluorescein angiography (FA) and indocyanine green angiography (ICGA) are the commonly employed imaging tools to investigate clinical features and to plan management for various retinal pathologies. OCT allows morphological and quantitative assessment whereas FA and ICGA detect anatomical location and leakage pattern. In certain conditions, both lead to discrepancies in data yielded and fail to provide details of deeper retinal capillary plexus and choroidal vasculature. This significantly affects our ability to understand the pathology and thus prognosis and management.1
FA however, has certain limitations as the dye is masked by retinal pigment epithelium (RPE) and gets leaked from choriocapillaris. ICG is also considered but being an invasive procedure it carries certain risks like brochospam, laryngospasm, anaphylaxis, cardiac arrest and is contraindicated in iodine allergy, hepatic disease, chronic renal failure patients on hemodialysis.
Optical coherence tomography angiography (OCTA) is a functional extension of OCT, which works on the priniciple of ‘de-correlation’. It uses interferometric analysis of short-coherence-length light from moving blood within the retina and choroid and calculates the variation over time of reflectance parameters (such as amplitude or phase).2 It generates 3-D maps of microvasculature flow pattern from retinal capillary plexus and choroidal vasculature and has enabled us to better understand, analyze and treat various retinal pathologies.3,4
OCTA imaging software scans and generates images on a voxel-by-voxel basis computation of de-correlation signal.5In a particular field of view, the software scans 512 voxels with 8 B-scans repeated at each voxel. At each voxel it performs 256 A-scans per B-scan with an inter-B-Scan distance of 10μ. The number of B-scans performed per voxel and the number of A-scans per B-scan varies according to the software and the algorithm used. The various algorithms incorporated in software perform computation of clusters of B-scans and generate a flow pattern due to motion of erythrocytes within the vasculature. This results in formation of en-face images of retinal capillary network and choroidal vasculature at various levels.6,7
OCTA software can scan only a limited field of view in various sizes of cubes based on examiners preference and also depending upon the location and size of pathology present. The most preferred field of views are 3x3mm and 6x6mm scans. Smaller is the size of cube, higher is the resolution obtained.8 Thus, it has a limitation of generating images with decreased resolution with an increased field of view.
Nidek RS-3000 “AngioScan” is the first to develop a novel “PANORAMA” imaging software. The Panorama feature provides multiple options of scanning larger fields of view like 12x9mm, 9x9mm, 6x6mm, 4.5×4.5mm (i.e. 40×30, 30×30, 20×20, 15×15 degree field of view respectively). (Figure 1). In all these varying fields of view, the software splits the scanning area into 3×3 small cubes. The resolution thus obtained is the same as that of an individual 3x3mm cube provided by other software and simultaneously scans larger field at the same time. The Panorama feature thus enables comprehensive retinal coverage. (Table 1)
In an attempt to capitalize on these advantages, we conducted a study and with an aim to explore the use of Panorama imaging software by comparing the features of novel Panorama OCT Angiography” (P-OCTA) with Fluorescein Angiography (FA) &Indocyanine Green (ICGA) in various posterior segment pathologies
Material and Methods:
Study design and patient enrolment:
This is a single-center, prospective, cross-sectional, observational study approved by the Institutional Review Board. All cases provided informed consent to be enrolled in the study anddata was collected from patients at retina clinic from January 2017 to June 2018.
Eligibility criteria and data collection:
Data was collected under the following headings: demographic details, history of presenting illness, eye laterality, history of associated systemic co-morbidities, clinical examination details including visual acuity at presentation and follow- up with multimodal imaging features, treatment details, complications (if any) and treatment given for that complication. Inclusion criteria were: clinical findings consistent with features suggestive of posterior segment pathologies included in studyand complete availability of documentation. If any one of the above-mentioned inclusion criteria was not met, patients were excluded from the study.
Study Parameters:
All cases underwent a complete eye examination at presentation and also at every follow-up visit.The examination protocol included best-corrected visual acuity (BCVA) with the help of Snellen’s Chart, dilated fundoscopic examination, color fundus images (Topcon 50 Dx, Medical Systems Inc, Oakland, NJ, USA), fundus autofluorescence (FAF), fundus fluorescein angiography (FFA), indocyanine green angiography (ICGA) (Spectralis, Heidelberg Engineering Inc, Heidelberg, Germany), and spectral domain-optical coherence tomography (SD-OCT)(Spectralis, Heidelberg Engineering Inc, Heidelberg, Germany). Panoramic optical coherence tomography angiography (P-OCTA) (RS-3000 Advance OCT, Nidek) was performed in all eyes centered on the fovea covering 12×9 mm area (40° x 30° field of view). AngioScan RS-3000 Advance software was used to segment the outer retinal layers and choriocapillaris.
Panoramic Optical Coherence Tomography Angiography:
For all cases, at presentation and follow-up, P-OCTA images were obtained by Panorama feature of AngioScan OCT Angiography software on the RS-3000 Advance OCT (Nidek, Japan). This feature enables scanning a wide area—12 x 9 mm, 9 x 9 mm, 6 x 6 mm, and 4.5 x 4.5 mm thus providing large fields of view, 40° x 30°, 30° x 30°, 20° x 20°, and 15° x 15° respectively.In each of these sizes of fields of view, the software splits the entire selected scanning area into small fixed 3 x 3–mm cubes. The resolution obtained with a generated panoramic image is therefore the same as that of an individual 3 x 3–mm cube provided by other software, but a larger field is simultaneously scanned at the same time. The en face images obtained with panorama OCTA allowed to visualize individual retinal vascular plexuses and choriocapillaris. For all cases, P-OCTA scan covering an area of 12×9 mm equivalent to 40° x 30° field of view, was used at presentation and also on each follow-up.
Fluorescein Angiography and Indocyanine Green Angiography:
Corresponding to panoramic area (12×9 mm) imaged on OCTA with fovea as the very center, simultaneous and corresponding FA and ICGA images were obtained once adequate pupillary dilation (minimum of 7 mm) was achieved, at baseline (prior to initiating therapy) and at subsequent follow-up visits (on the discretion of the treating clinician).Sequential fundus images were obtained from early to late frames in all cases. Heidelberg Spectralis® (Heidelberg Engineering, Heidelberg, Germany) was used to acquire the angiography images.
Image Analysis:
For all cases, images were examined by two independent masked examiners. These examiners were ophthalmologists with subspecialty training in retina and uveitis (MN and NM). P-OCTA images were analyzed using the Angioscan software (RS-3000Advance). The software divided the retinal and choriodalvasculature into pre-defined slabs for segmentation (superficial and deep retinal vascular plexus, outer retina and choriocapillaris), however, manual segmentation was used to confirm the findings on P-OCTA. Images of only the choroidal vasculature generated on P-OCTA were compared, correlated and analysed with ICGA and FA images of corresponding region. This helped to assess whether P-OCTA scan can non-invasively help in detection of similar features as provided by invasive ICGA and FA.
Statistical Analysis:
Descriptive analysis was used to compare the appearance of the panoramic OCTA imaging with FA & ICGA
Results:
126 eyes of 86 patients were studied. 50 cases were males and 36 were females.All subjects included in the study were Asian Indians. Out of all eyes included, 18 eyes had CSR (10 had acute, 8 had chronic presentation, 10 were pre-treatment and were 4 post-treatment cases), 32 eyes had serpigenous like choroiditis lesions (18 active and 14 healing), 50 eyes had diabetic retinopathy (30 non-proliferative and 20 proliferative), 20 eyes had venous occlusion (10 branch vein occlusion and 10 central vein occlusion) and 6 eyes had retinal vasculitis. Few eyes included had lesions inside FAZ and few outside. 46 eyes had unilateral and 40 eyes had bilateral presentation.
Comparisons between Panoramic Optical Coherence Tomography Angiography, Indocyanine Green Angiography, and Fluorescein Angiography
Cases with CSC showed an image pattern of areas of increased decorrelation signals (high signal intensity) in the OCT angiograms (P-OCTA) (Figures 2). Among the 15 eyes, 10 eyes additionally demonstrated dilated capillaries in the OCT angiograms. Among the 18 patients, leakage was observed in 14 eyes, whereas transmitted fluorescence and no obvious fluorescein leakage were observed in 2 eyes and 2 eyes, respectively. All eyes with CSC showed a choroidalhyperpermeability on ICGA. The areas that showed high signal intensity or dilated choriocapillaris in the OCT angiograms demonstrated a leakage in fluorescein angiography and hyperpermeability in indocyanine green angiography.
Cases with SLC during active stages showed areas of large flow void (decreased decorrelation signals) and during healing stages showed areas of choriocapillaris re-perfusion which exactly correlated topographically with ICGA and FA as areas of hypofuorescence during active stages and isofluorescence during healing stages. (Figure 3 & 4)
In cases of diabetic retinopathy, Fluorescein angiography (FA) examination revealed FAZ, areas of leakage suggestive of NVE/NVD, focal leakage and staining of laser marks.12×9 mm Panorama OCTA examination of OD showed FAZ, well demarcated architecture of vessels under NVE/NVD (leakage in FA) altered choriocapillary pattern at RPE-BM level in areas of laser scar marks. (Figure 5)
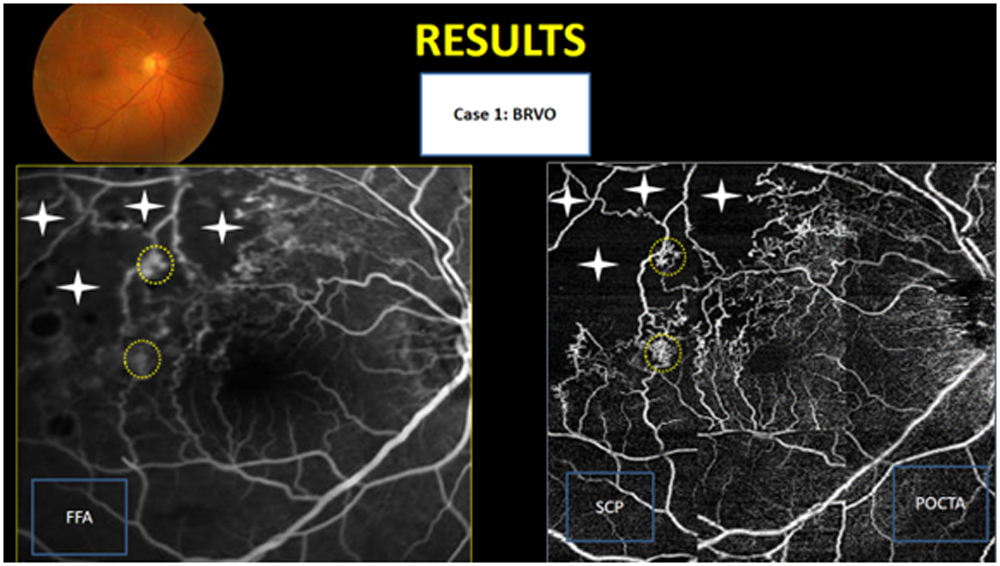
In cases of retinal vein occlusion, Fluorescein angiography (FA) examination revealed altered FAZ, staining of laser marks, collateral vessels. 12×9 mm Panorama OCTA examination of showed altered FAZ, clearly demarcated architecture of collateral vessels and altered choriocapillary pattern at RPE-BM level in areas of laser scar marks. (Figure 6)
Discussion:
FA is considered as the gold standard imaging modality and is widely used in variety of ocular disorders, some of which require repeated imaging. 9-13It provides information of retinal vasculature, which is limited only to the superficial capillary plexus and also lacks penetration to the choroid and thus fails to provide details of choroidal vasculature.4 In addition to FA, ICGA has the ability of choroidal penetration and provides details of choroidal vascular pathologies.
Conventional angiography (FA & ICGA) has some disadvantages. Being invasive, requiring intra-venous dye injections, these examinations can cause side effects as extravasation, nausea, vasovagal reaction, and anaphylaxis. They carry systemic risks, and are expensive and resource intensive. FA is contraindicated in pregnancy, in children or in patients with renal or cardiac disorders. Repeatability is a major concern because of invasive nature and hence follow-up examination is difficult.9, 14-18
OCTA is a revolutionary imaging modality that could detect retinal and choroidal blood flow compromise before the appearance of clinically apparent changes. It has enabled us to visualise retino-choroidal vascular structure by detecting the reflectance phase and amplitude variation (complex variation) of blood flow (motion of erythrocytes) over time to distinguish vessels from static tissue.19,20 It has thus provided us a new insight to better understand and manage retinal and choroidal pathologies.
OCTA with the advent of a unique Panorama imaging feature can mimic the findings of FA and can replicate these on each follow-up exam non-invasively. Although OCTA surpasses certain limitations of conventional angiography (e.g. invasiveness, cost, resource intensive, contraindications), this imaging modality is still in its infancy, with lots of scope and technical refinement. It provides smaller field of view, low resolution and static image as compared to conventional FA.2During the process of image acquisition various artifacts can occur due to eye movement, tremors, circardianrhytm, breathing and image processing. These limitations should further improve as the technology refines itself.
To conclude, OCTA panorama is a unique imaging tool that can replicate the findings of conventional angiography non-invasively. It has enabled the ophthalmologists to replace FA and ICGA in certain situations (cases with contraindications, side effects with previous examinations, follow-up). But since it’s a nacent technology, our experience is still limited. Prospective, longitudinal studies with larger cohorts are required to validate the accuracy of results and reproducibility of data generated. In near future, with advancements in medical engineering and further upgradation of softwares and technology, we hope to generate imaging software that can provide images with high resolution and a much larger field of view. Nonetheless, it is certainly a promising imaging modality and is the future of retinal imaging.
Abbreviations:
OCTA: optical coherence tomography angiography
ICGA: indocyanine green angiography
FA: fluorescein angiography
OCT: optical coherence tomography
References
1. Shoughy SS, Kozak I. Selective and complementary use of Optical Coherence Tomography and Fluorescein Angiography in retinal practice. Eye Vis (Lond). 2016 Oct 17;3:26
2. Nagpal M, Singh SS. OCT angiography in retinal and choroidal diseases.Retina Today. November/December 2016.
3. GhasemiFalavarjani K, Al-Sheikh M, Darvizeh F, Sadun AA, Sadda SR. Retinal vessel calibre measurements by optical coherence tomography angiography. Br J Ophthalmol. 2016 Nov 16.
4. Spaide RF, Fujimoto JG, Waheed NK. Image artifacts in optical coherence tomography angiography. Retina. 2015 Nov;35(11):2163-80
5. Moult EM, Waheed NK, Novais EA, Choi W, Lee B, Ploner SB, Cole ED, Louzada RN, Lu CD, Rosenfeld PJ, Duker JS, Fujimoto JG. Swept-source optical coherence tomography angiography reveals choriocapillaris alterations in eyes with nascent geographic atrophy and drusen-associated geographic atrophy. Retina. 2016 Sep 30
6. Zhang Q, Wang RK, Chen CL, Legarreta AD, Durbin MK, An L, Sharma U, Stetson PF, Legarreta JE, Roisman L, Gregori G, Rosenfeld PJ. Swept source optical coherence tomography angiography of neovascular macular telangiectasia type 2. Retina. 2015 Nov;35(11):2285-99
7. Roisman L, Zhang Q, Wang RK, Gregori G, Zhang A, Chen CL, Durbin MK, An L, Stetson PF, Robbins G, Miller A, Zheng F, Rosenfeld PJ. Optical Coherence Tomography Angiography of Asymptomatic Neovascularization in Intermediate Age-Related Macular Degeneration. Ophthalmology. 2016 Jun;123(6):1309-19
8. OCT-Angiography Software for RS-3000 Advance AngioScan. Eye & Health Care, Nidek Co., Ltd.
9. Lumbroso B, Huang D, Jia Y, Fujimoto J, Rispoli M (2015). Clinical Guide to Angio-OCT (Non Invasive, Dyeless OCT Angiography). London:Jaypee Brothers Medical Publishers (P) Ltd.
10. D.A.Sim, P.A.Keane, J.Zarranz-Venturaetal.,“Theeffects of macular ischemia on visual acuity in diabetic retinopathy,” Investigative Ophthalmology & Visual Science, vol.54, no.3, pp. 2353–2360, 201
11. T.E.deCarlo, A.Romano, N.K.Waheed, and J.S.Duker,“A review of optical coherence tomography angiography (OCTA),” International Journal of Retina and Vitreous, vol.1, no.1, pp.1–15, 2015
12. T. E. de Carlo, M. A. BoniniFilho, A. T. Chin et al., “Spectral-domain optical coherence tomography angiography of cho-roidalneovascularization,”Ophthalmology, vol.122, no.6, pp. 1228–1238, 2015
13. Garcia JM, Lima TT, Louzada RN, Rassi AT, Isaac DL, Avila M. Diabetic Macular Ischemia Diagnosis: Comparison between Optical Coherence Tomography Angiography and Fluorescein Angiography. J Ophthalmol. 2016;2016:3989310
14. Yu S, Lu J, Cao D, Liu R, Liu B, Li T, Luo Y, Lu L. The role of optical coherence tomography angiography in fundus vascular abnormalities. BMC Ophthalmol. 2016 Jul 13;16:107
15. Lipson BK, Yannuzzi LA. Complications of intravenous fluorescein injections. IntOphthalmolClin. 1989;29(3):200-5
16. Pacurariu RI. Low incidence of side effects following intravenous fluorescein angiography. Ann Ophthalmol. 1982;14(1):32-6
17. Lopez-Saez MP, Ordoqui E, Tornero P, Baeza A, Sainza T, Zubeldia JM, et al. Fluorescein-induced allergic reaction. Ann Allergy Asthma Immunol. 1998; 81(5 Pt 1):428-30.
18. Stanga PE, Lim JI, Hamilton P. Indocyanine green angiography inchorioretinal diseases: indications and interpretation: an evidence-based update. Ophthalmology. 2003;110(1):15–21
19. Jia Y, Bailey ST, Wilson DJ, Tan O, Klein ML, Flaxel CJ, et al. Quantitative optical coherence tomography angiography of choroidal neovascularization in age-related macular degeneration. Ophthalmology. 2014;121(7):1435–44
20. Jia Y, Tan O, Tokayer J, Potsaid B, Wang Y, Liu JJ, et al. Split-spectrum amplitude-decorrelation angiography with optical coherence tomography. Opt Express. 2012;20(4):4710–25
21. Jia Y, Bailey ST, Hwang TS, McClintic SM, Gao SS. Quantitative optical coherence tomography angiography of vascular abnormalities in the living human eye. 2015;112(18):E2395- 402
Table 1
Comparison between Panoramic OCTA and routine 3×3 mm OCTA
| Features | Panoramic OCTA | 3x3mm OCTA |
| 1. Field of view | Maximum
40×30 degrees (12×9 mm) |
Maximum
10×10 degrees (3×3 mm) |
| 2. Resolution of Image | High | High |
| 3. Stereopsis | Present | Present |
| 4. 3-D | Present | Present |
| 5. Mydriasis | Non-mydriatic | Non-mydriatic |
| 6. Time | 5-10 minutes | 30 seconds-1 minute |
Figures:
Figure 1:
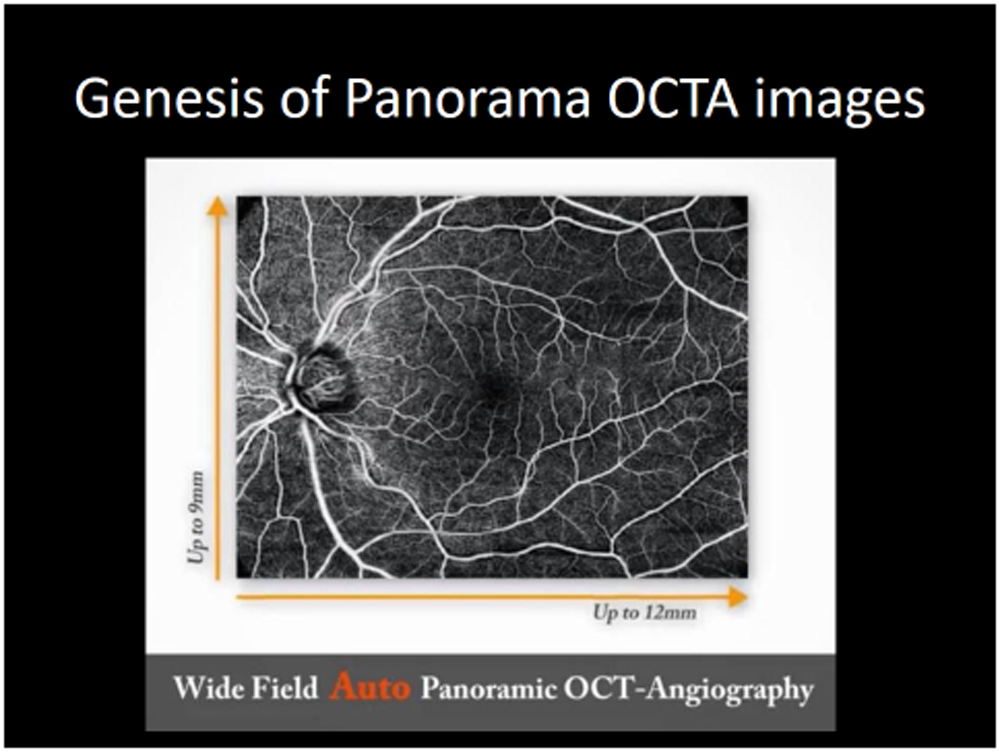
Figure 2:
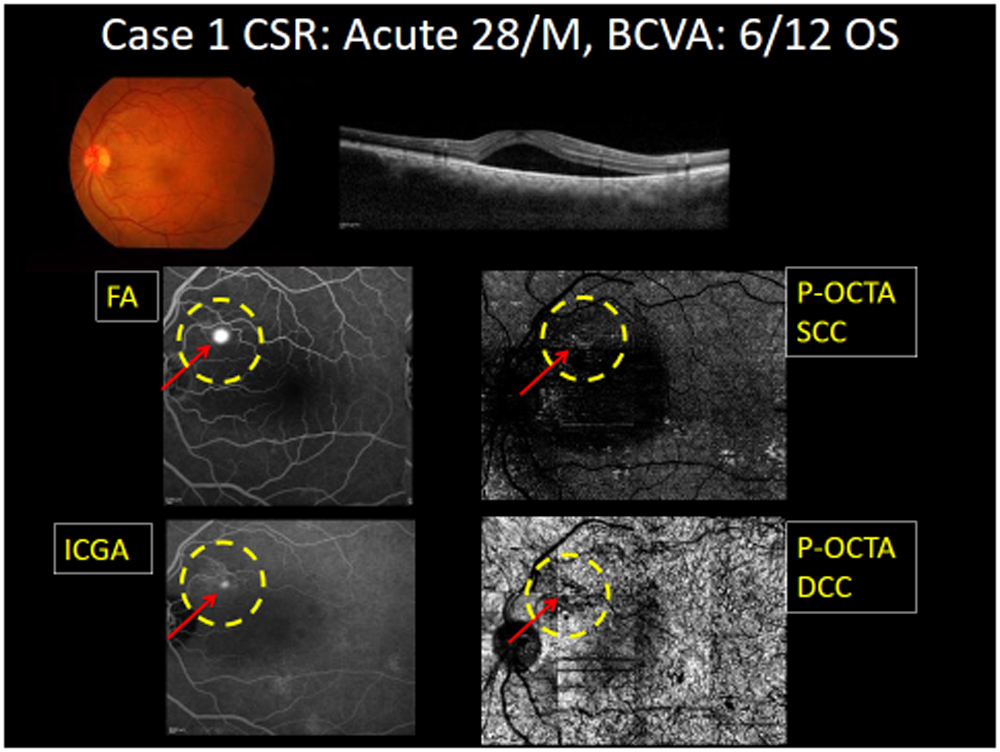
Figure 3:
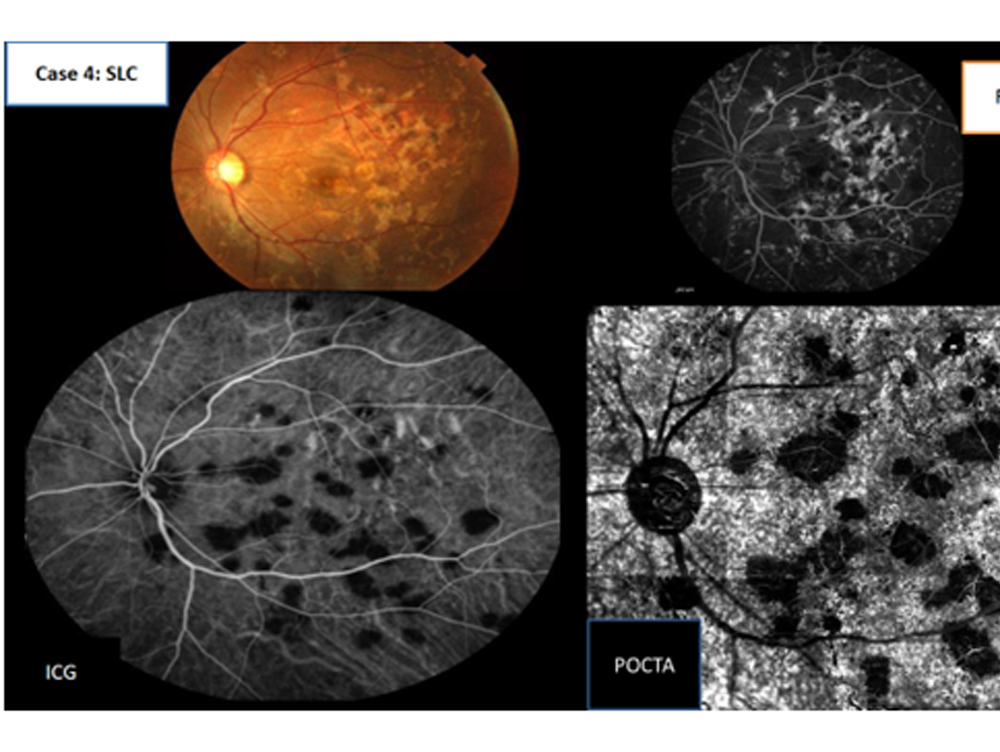
Figure 4: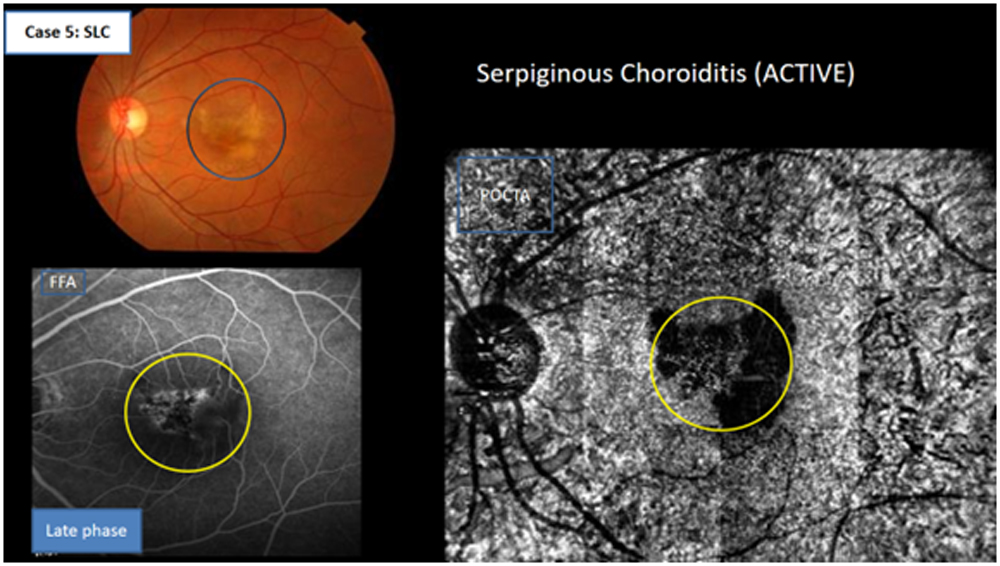
Figure 5:
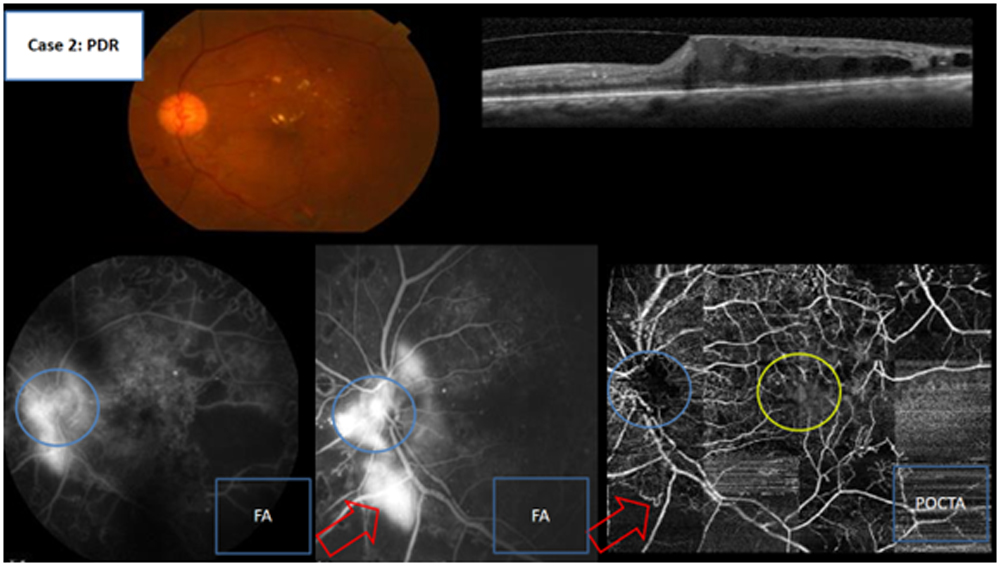
Figure 6:
Leave a Comment