

Dr.Anmol Ulhas Naik,Dr.Amit Palkar,Dr.Mohan Rajan,Dr.Jyotirmay Biswas
Aim: To report OCT angiography (OCTA) features in correlation with fluorescein angiography (FA) and indocyanine green angiography (ICGA) in serpiginous choroiditis.
Methods: OCTA was performed in patients of peripapillary, macular and multifocal serpiginous choroiditis. Images were analysed in relation to FA and ICGA.
Results: In 22 eyes of 12 subjects, en face OCTA images revealed discrete flow void areas beneath RPE-Bruch’s complex. This feature, suggestive of choriocapillarishypoperfusion, correlated well with ICGA in healed lesions but was confounded by artifacts in active lesions. In 4 eyes where pre and post-treatment OCTA was available, partial reperfusion of hypoperfused areas was observed post treatment. Choroidal neovascular network was observed on OCTA in 1 case where leakage was seen on ICGA and FA.
Conclusion: OCTA along with ICGA and FA can aid in studying the pathogenesis and management of serpiginous choroiditis. In healed lesions, ICGA correlates better with OCTA.
Keywords:
Serpiginous Choroiditis
Uveitis
OCT angiography
Multimodal imaging
Autofluorescence
Introduction
Serpiginous choroiditis (SC), serpiginous-like choroiditis (SLC) and multifocal serpiginoid choroiditis (MFSC) are choroiditis entities that rest on a fine line/ grey area that distinguish them from each other. Serpiginous choroiditis is a chronic recurrent form of posterior uveitis with centrifugal spread with an active advancing edge.[1]SLC[2] and MFSC[3] have been described in tuberculosis-endemic areas. Typically bilateral and asymmetric, the lesions of SC are named so because they are characterised by grey-white or yellow infiltrates in peripapillaryregion and develop in an irregular serpentine pattern with a centripetal or helicoid progression, giving ‘geographic’ distribution.[4] They can spread to the macular region to involve the fovea, or arise de-novo at the macula, in which case the term ‘macular’ SC is used. The conditionis characterized by a chronic course with multiple recurrences and scarring over several years. This makes studying their natural course and their treatment a difficult affair. Clinical features, fundus autofluorescence (FAF), fluorescein angiography (FA) and indocyanine green angiography (ICGA) have remained the mainstay in diagnosing SC. Over the recent years, optical coherence tomography angiography (OCTA) has emerged as a newer non-invasive tool that can image the retinochoroidal circulation effectively. Previous studies have reported the use of multimodal imaging and its correlation with OCTA in serpiginous choroiditis.[4-7]We report the features of SC usingmultimodal imaging in the Indian population.
Materials and methods:
A retrospective study was conducted at the uvea clinic of a tertiary care eye centre in south India. Institutional Ethics Committee clearance was obtained prior to initiation of the study and it adhered to the tenets of Declaration of Helsinki. Hospital database records of patients presenting to the uvea clinic from January 2017 to March 2018 were reviewed, searching for patients with the diagnosis of serpiginous choroiditis who had undergone multimodal imaging [Colour fundus imaging with FAF, FA, ICGA, optical coherence tomography (OCT)]and OCTA. A diagnosis of ‘serpiginous choroiditis’ was retrieved in 36 patients. Of these, multimodal imaging was not available in 14 patients and hence, they were excluded from the study. In all patients with diagnosis of serpiginous choroiditis, other Etiologies known to mimic SC such as tuberculosis, toxoplasmosis and sarcoidosis had been ruled out. Tuberculosis especiallywas ruled out by a negative Mantoux/ normal HRCT chest study/ negative QuantiFERON TB gold test/ aqueous tap PCR negative for the MPB64 and IS6110 regions of TB bacilli genome, these tests being performed in all patients. 10 patients with media opacity precluding adequate fundus examination and imaging were also excluded. Colour fundus images, FAF, FA, ICGA and OCT were performed using the Heidelberg Spectralis HRA-OCT (Heidelberg Engineering, Heidelberg, Germany). OCT angiography was performed using theAngioPlexTMOCT angiography (Carl Zeiss Meditec Inc., Dublin, CA, USA).
The lesions of SC were classified into four stages based on the FAF patterns described by Bansal et. al.[3] for tubercular serpiginous like choroiditis. Stage 1 comprised of ill-defined hyperautofluorescence throughout the lesion, Stage 2: thin rim of hypoautofluorescence surrounding the lesion, Stage 3: predominantly hypoautofluorescent lesion with stippled pattern and stage 4: hypoautofluorescence within the lesion. Active lesions were defined as those demonstrating stage 1 FAF pattern, resolving as either stage 2 or stage 3 and healed as stage 4. The OCTA images obtained on the AngioPlexTMsoftware were analysed to study the retinochoroidal vasculature at the level of inner retina, outer retina, choriocapillaris and the choroid. The en face OCTA structural and angiographic images were compared with colour fundus images, FAF, OCT, FA and ICGA to study the correlation, if any, between them. By default 3mm X 3mm OCTA scans were obtained. In case the lesion to be studied was larger, 6mm X 6mm scans were obtained. While moving the OCTA scans from the inner retina towards the choroid, manual segmentation was employed.The images were independently analysed by two authors. In case of disparity in the interpretation, a third author made the interpretation to arrive at a conclusion.A descriptive analysis was used to compare the images of aforesaid investigations
Results:
22 eyes of 12 patients were included in this study. The cohort comprised of 10 males and two females, in the age range of 16 to 54 years. The mean age of the cohort was 35.78 ± 10.71 years. All patients were of Indian ethnicity. At the time of presentation, seven eyes had active lesions, five eyes had resolving lesions, and ten eyes had resolved lesions. 10 patients had bilateral involvement while the disease was unilateral in four patients. The treatment protocolfollowed was intravenous methylprednisolone (1g i.v. for three days) followed by oral azathioprine (50mg TDS) with weekly tapering oral prednisolone (1mg/kg body weight).
Active lesions
The seven eyes with active lesions clinically presented with yellowish lesions with ill-defined margins at the level of choroid [Fig. 1a, 1b]. Four out of these sevencases presented with macular variant of SC. The involvement was asymmetrical and bilateral in three patients. In cases where the macula was involved, the chief presenting complaint was sudden painless diminution of vision. All active lesions demonstrated stage 1 FAF pattern, i.e., ill-defined hyperautofluorescence throughout the lesion [Fig. 1c, 1d]. The FA demonstrated variable patterns of hyperfluorescence and hypofluorescence. In the early stages, hypofluorescent areas were observed in areas of active lesions [Fig. 2b], which became hyperfluorescent in the late phases due to leakage as well as staining of tissue in some cases[Fig. 2d]. However, this pattern of FA did not strictly correlate in all active lesions.ICGA in all active lesions demonstrated uniform hypocyanescence predominantly in all the phases of the angiogram [Fig 2c,2e], which correlated with the clinical picture. The ICGA hypocyanescence corresponded well with areas of flow void on OCTA in the active lesions.[Fig. 3e]OCTA angiographic images demonstrated apparent areas of flow void in the choriocapillaris layer with intermittent preserved islands [Fig. 4d]. However, to ascertain whether these areas of flow void were due to actual choriocapillaris loss or due to decreased signal transmission, we compared the angiographic images and the OCT B scans [Fig. 4b] with the en face structural OCTA image [Fig. 4c] and the ICGA images [Fig. 4e]. It was observed that the dark areas on angiographic images [Fig. 4d, yellow arrow] corresponded to areas of uniform hypofluorescence observed on ICGA [Fig. 4e, yellow arrow]. But on one-to-one correspondence with structural en face images, these dark areas also corresponded to the areas of decreased signal transmission on structural en face images [Fig. 4c, yellow arrow].
Resolving lesions
Five eyes had resolving lesions at the time of presentation. All five demonstrated FAF pattern of either stage 2 or stage 3 or a combination of both. [Fig. 1f, 1h, 3a, 3b] The FA showed hyperfluorescence due to staining of the scarring areas [Fig. 3c, yellow circle] and hypofluorescence of the active edges in all lesions. [Fig. 3c, red oval]. The ICGA demonstrated uniform hypocyanescence in the early phases but in the later phases, the scarring areas revealed hypercyanescence[Fig. 3d, yellow circle] with the active edges remaining hypocyanescent.[Fig. 3d, red oval]Both FA and ICGA images correlated well with the FAF images in resolving stages. The OCTA angiographic images demonstrated flow void lesions similar to the active lesions [Fig. 3g, blue arrow], corresponding with areas of preserved signal transmission on en face structural images [Fig. 3f, blue circle]. On comparison with the ICGA images, these areas demonstrated isocyanescence [Fig. 3d, blue circle].
OCTA correlation in active and resolving eyes post 1 month treatment
In five of the seven active cases, OCTA was available in the active stage at presentation and also 1 month after initiating the treatment.The flow void areas visualized in active stages [Fig. 4d] showed apparent ‘partial reperfusion’ in the resolving stage after 1 month [Fig. 4i]. When correlated with the structural en face OCTA images [Fig. 4c],it was evident in these ‘partial reperfusion’ areas,there was recovery of signal transmission [Fig. 4h, yellow arrow]which was previously decreased [Fig. 4h].
Resolved lesions
Multimodal imaging of a protoype of resolved serpiginous choroiditis is shown in figure5. In the resolved or healed stage, the lesions clinically showed varying degrees of RPE hyperplasia and chorioretinal atrophy with fibrosis [Fig. 5a]. The FAF showed uniform hypofluorescence within the lesion (stage 4) in all cases [Fig. 5b]. The FA showed blocked fluorescence in areas on RPE hyperplasia and hyperfluorescence at the the border of the lesions due to staining of scar tissue [Fig. 5c]. The OCTA en face angiographic images revealed areas of flow void, revealing underlying medium-sized choroidal vessels and preserved islands of choriocapillaris interspersed in between [Fig. 5e, blue outline]. On correlating with structural en face images [Fig. 5f] and OCT B scan [Fig. 5g], the areas of flow void were seen to represent areas of actual choriocapillaris loss as the signal transmission was preserved and theICGA showed uniform hypocyanescence in region of scar tissue [Fig. 5d]. In one case of healed SC [Fig. 6], leakage was seen at the fovea on FA [Fig. 6c, enlarged in inset] and hypercyanescence corresponding to the FA leakage was seen on ICGA [Fig. 6d]. The OCTA revealed an underlying sea fan shaped choroidal neovascularization(CNV) network at the outer retinal segmentation slab [Fig. 6e]. The patient was advised intravitreal anti-vascular endothelial growth factor (VEGF) injection but was not keen on any intervention.
Discussion
Serpiginous choroiditis is a rare but chronic and relapsing disease that can seriously impair vision, especially when the fovea is involved. Histopathological findings have shown predominant involvement of the choriocapillaris which is characterised by diffuse large lymphocytic infiltration.[8] The peculiarity of this condition is that one eye may have active disease while the other eye may have resolved/ resolving disease. Even within the same eye, certain areas may have active lesions while other areas may be inactive. In such a scenario, it is quite challenging to decide when to treat the patient. Multimodal imaging has been proven to be useful in the diagnosis and management of SC.[4-7]OCTA allows the segmentation of retinochoroidal vasculature at the level of inner retina, outer retina, choriocapillaris and the deeper choroid.
This allows an in-depth analysis ofchoriocapillaris microvasculature, primarily affected in SC, without the need for invasive tests. However, caution must be exercised before directly interpreting the OCTA results as the overlying retinal structures/ lesion may cause projection artifacts on en-face angiographic imaging. We found areas of apparent flow void in active stages of SCon OCTA in our cohort. Correlation with the corresponding OCT B-scan and en-face structural OCTA images may lead the interpreter to hastily conclude that these could be areas of decreased signal transmission probably due to the inflammatory edema or RPE thickening. In sucha situation, ICGA, whose features cannot be blocked by RPE status, proves quite helpful. In the active lesions, there was uniform hypocyanescence in ICGA corresponding to the dark areas in angiographic OCTA images.
Thus it was concluded that these dark areas do represent actual choriocapillaris ischemia/ choriocapillaris loss and the artefact of decreased signal transmission is only partly contributory. This corroborates with the findings of Mandadiet. al.[9] as reported in their study in tubercular MFSC.It is well known that the decorrelation signal in the OCTA has a saturation limit, I.e., it becomes identical above a certain value, irrespective of the flow velocity. The areas of flow void may imply capillary loss/ hypoperfuson or sluggish flow that may be below the limits of detection.[4,9]Montorio et. al.[4] have suggested that the absence of flow in active lesions suggests the loss of detectable flow of the whole choroid. Correlation with the corresponding enhanced depth imaging (EDI)-OCT can be a useful clue in this regard where features of choriocapillaris thickening on the EDI-OCT will be seen in active lesions with ischemia of the choriocapillaris.[9] This is substantiated by the fact that in our cohort of patients where the pre- and post-treatment images were available, areas of apparent ‘reperfusion’ in previously flow void choriocapillaris segmentation slab also demonstrated a corresponding increase in signal on the en-face structural OCTA image along with corresponding isocyanescence on ICGA.
This reiterates the fact that OCTA should not be used as the gold standard for evaluation of the choriocapillaris microvasculature. Rather it should be correlated with ICGA which is the current gold standard to study the choroidal vasculature.In resolved lesions, the OCTA is less plagued by artifacts and identifies the unmasked larger choroidal vessels beneath the atrophied choriocapillaris. Montorioet. al.[4] measured the choroidal vessel density in different areas using swept-source (SS) OCTA and have suggested that in these atrophic regions, choriocapillaris is lacking and the resultant vascular rarefaction causes a decrease of vessel density. A limitation of our study was that we did not measure the choroidal vessel density in the affected and unaffected areas and hence we cannnot comment upon the same. CNV has been reported in other choroidal inflammatory pathologies such as multifocal choroiditis (MFC) and punctate inner choroidopathy (PIC)[11-13]. Against the background of scarring and variable atrophy in resolved lesions of SC, it may be difficult to detect a CNV clinically or on the conventional OCT B-scan. We believe OCTA can be a useful adjunct to objectively demonstrate a CNV network in case of a suspect leak on FA, as was demonstrated in one of our patients.
In conclusion, multimodal imaging and correlation of OCTA with conventional angiographies can provide valuable information regarding the pathogenesis of SC and also help clinicians to monitor and prognosticate response to treatment by objective quantification of the choroidal microvasculature.While FAF provides an idea about the disease progression by demonstrating the RPE function, OCTA can reveal the actual changes at the level of microvasculature. However, diagnosis and management should not be planned on the basis of OCTA alone, as OCTA has its own pitfalls. Our observations are limited by the fact that this was a cross-section retrospective series and rarer causes of infectious non-tubercular SC such as Franciscellatularensis, Bartonellahenselae[14] were not ruled out.Our study also lacked histopathological correlation to the in-vivo vasculature status imaged by OCTA. Future studies may consider this aspect. To the best of our knowledge, this is the largest series of serpiginous choroiditis with OCTA features reported till date.
References:
- Nazari H, Rao NA. Serpiginous choroiditis and infectious multifocal serpiginoid choroiditis. SurvOphthalmol. 2013;58(3):203-232.
- Gupta V, Gupta A, Arora S, Bambery P, Dogra MR, Agarwal A. Presumed tubercular serpiginous-like choroiditis: clinical presentations and management.Ophthalmology 2003;110(9):1744-9.
- Bansal R, Gupta A, Gupta V, Dogra MR, Sharma A, Bambery P. Tubercular serpiginous-like choroiditis presenting as multifocal serpiginoid choroiditis.Ophthalmology 2012;119(11):2334-42.
- Montorio D, Giuffrè C, Miserocchi E, et. al. Swept-source optical coherence tomography angiography in serpiginous choroiditis. Br J Ophthalmol. 2018;102(7):991-995
- Ahn SJ, Park SH, Lee BR. Multimodal Imaging Including Optical Coherence Tomography Angiography in Serpiginous Choroiditis.OculImmunolInflamm. 2017;25(2):287-291.
- Pakzad-Vaezi K, Khaksari K, Chu Z, Van Gelder RN, Wang RK, Pepple KL.Swept-source OCT angiography of serpiginous choroidits.Ophthalmology Retina 2018;2(7):712-719.
- Khan HA, Shahzad MA.Multimodal Imaging of Serpiginous Choroiditis.Optom Vis Sci. 2017;94(2):265-269.
- Wu JS, Lewis H, Fine SL, et al. Clinicopathologic findings in a patient with serpiginous choroiditis and treated choroidal neovascularization. Retina 1989;9:292–301.
- Mandadi SKR, Agarwal A, Aggarwal K, et. al. Novel findings on optical coherence tomography angiography in patients with tubercular serpiginous-like choroiditis. Retina. 2017;37(9):1647-1659.
- Lim WK, Buggage RR, Nussenblatt RB. Serpiginous choroiditis. SurvOphthalmol 2005;50:231–244.
- Cheng L, Chen X, Weng S, et al. Spectral domain optical coherence tomography angiography findings in multifocal choroiditis with active lesions. Am J Ophthalmol 2016;169:145–61.
- Levison AL, Baynes KM, Lowder CY, et al. Choroidal neovascularisation on optical coherence tomography angiography in punctate inner choroidopathy and multifocal choroiditis. Br J Ophthalmol 2017;101:616–22.
- Zahid S, Chen KC, Jun JJ, et al. Optical coherence tomography angiography of chorioretinal lesions due to idiopathic multifocal choroiditis. Retina 2016; 37:1541–63.
- Portero A, Careño E, Real LA, Villarón S, Herreras JM. Infectious Nontuberculous Serpiginous Choroiditis. Arch Ophthalmol.2012;130(9):1207–1208.
Financial disclosures: None
Conflicts of interest: None
FIGURES
Figure 1: Serpiginous choroiditis – clinical spectrum
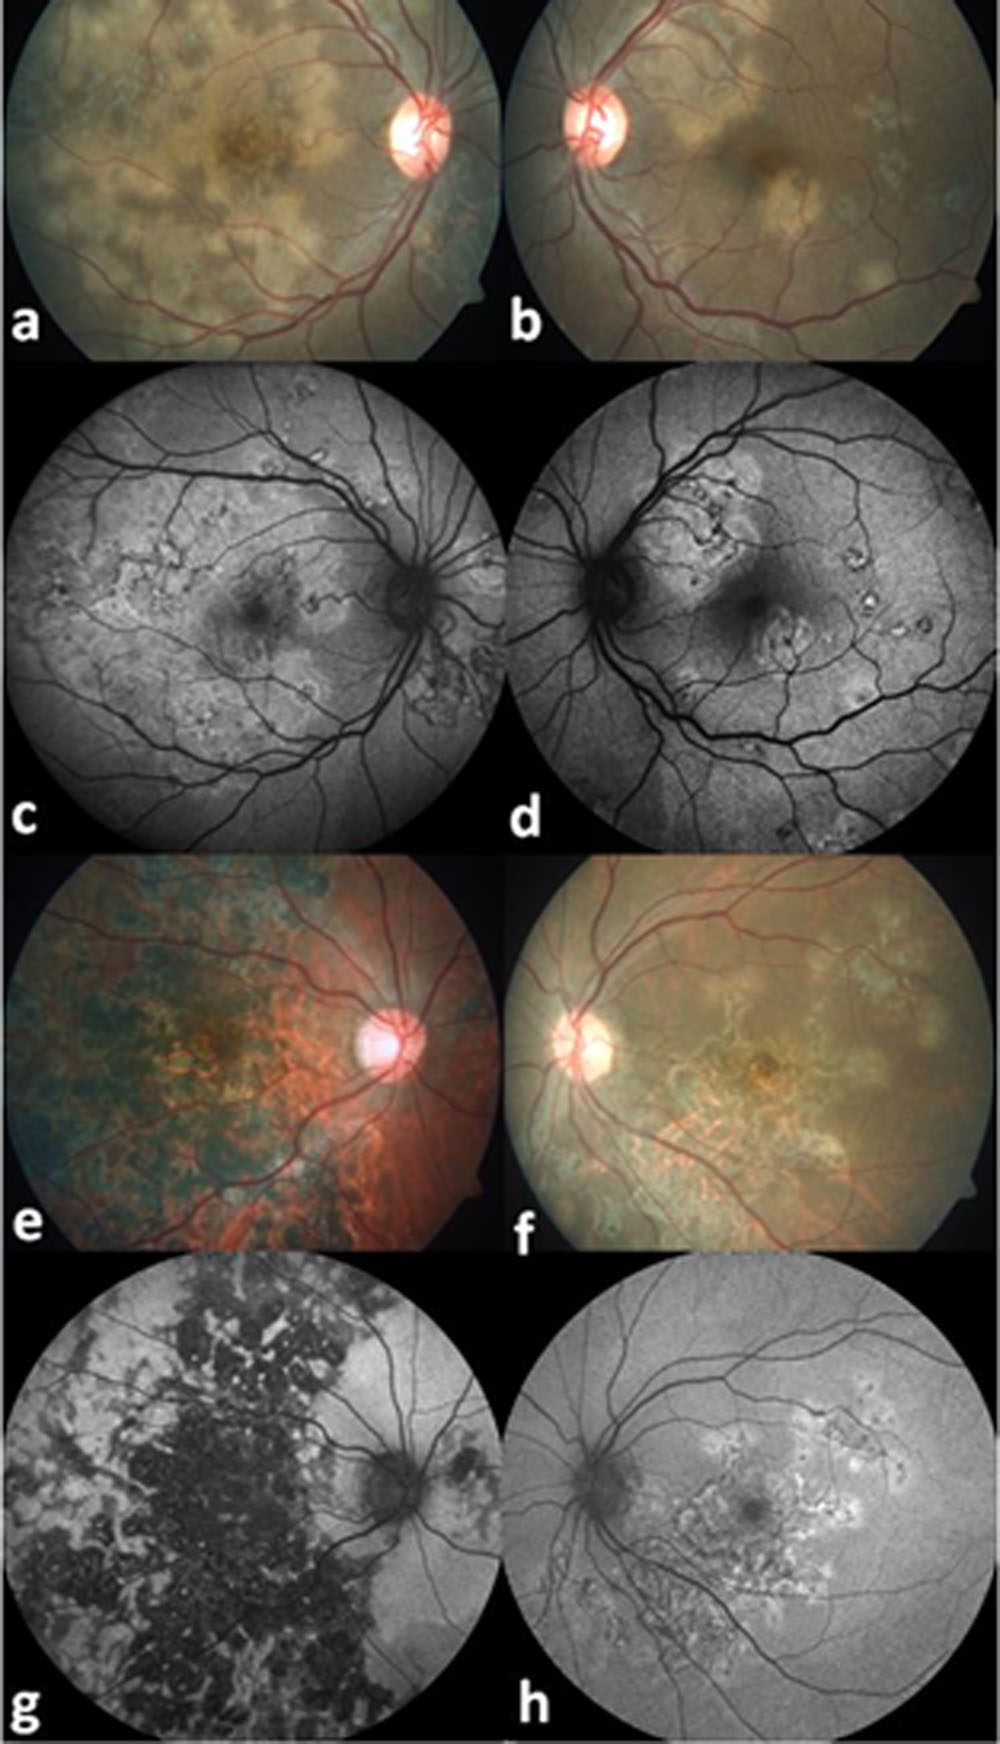
a,b: right and left eye of 29-year old with active serpiginous choroiditis. Note the asymmetrical involvement in both eyes with almost uniform hyperautofluorescence in fundus autofluorescence [FAF] (c,d). e – resolved serpiginous choroiditis in the right eye of a 33-year-old female with corresponding FAF (g) demonstrating uniform hypoautofluorescence..f – left eye of 43-year-old male with resolving serpiginous choroiditis with corresponding FAF (h). Note the hypoautofluorescent scarring areas centrally with hyperautofluorescent active edge
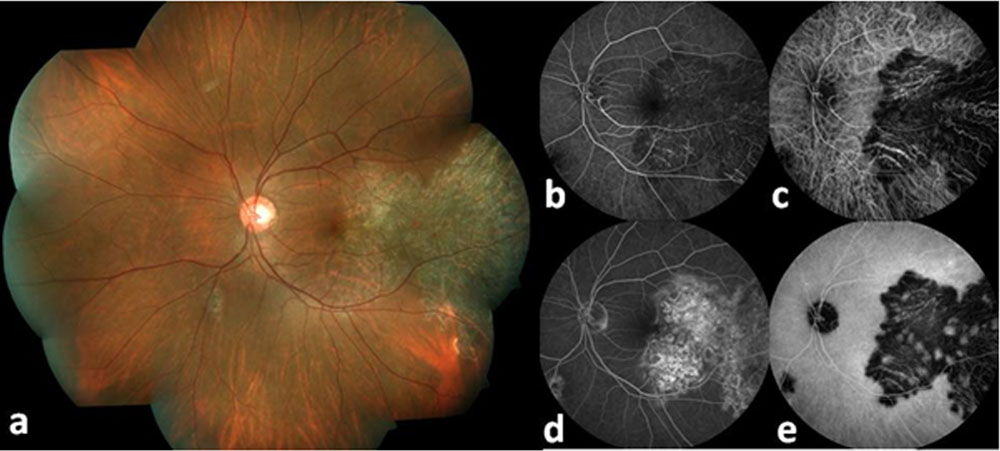
Fig. 2: FA and ICGA in active serpiginous choroiditis
39-year-old with active macular serpiginous choroiditis in left eye. The early phase FA (b) demonstrated uniForm hypofluorescence which turned into hyperfluorescence in late phases (d). However the ICGA remained predominantly hypocyanescent in early (c) as well as late phases (e).
Fig.3: Resolving serpiginous choroiditis – multimodal imaging with OCTA
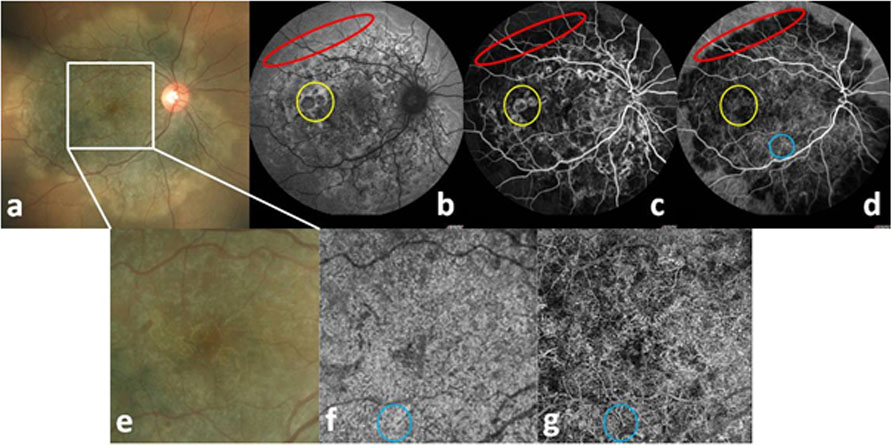
49-year-old with resolving serpiginous choroiditis. a: colour fundus photo b: FAF demonstrating hypoautofluorescence of the central scarring areas with hyperautofluorescence of the active edge. This hyper- and hypo- pattern corresponded well with the FA (c) and ICGA (d) pattern (yellow circle demonstrates a couple of scarring areas which have become hypo on FAF but hyper- on FA and ICGA, while the red oval demonstrates the active edge which is hyper on FAF but hypo- on FA and ICGA). f: OCTA en face structural and g: OCTA en face angiographic image demonstrating areas of choriocapillaris loss in scarring areas, where underlying larger choroidal vessels are prominent. Note that on ICGA (d, blue circle) the marked area shows isocyanescence with corresponding preserved signal transmission on structural en face (f, blue circle), yet the angiographic image shows choriocapillaris loss with maasking of underlying choroidal vessels (g, blue circle)
Fig. 4: Active serpiginous choroiditis with OCTA – pre and post treatment
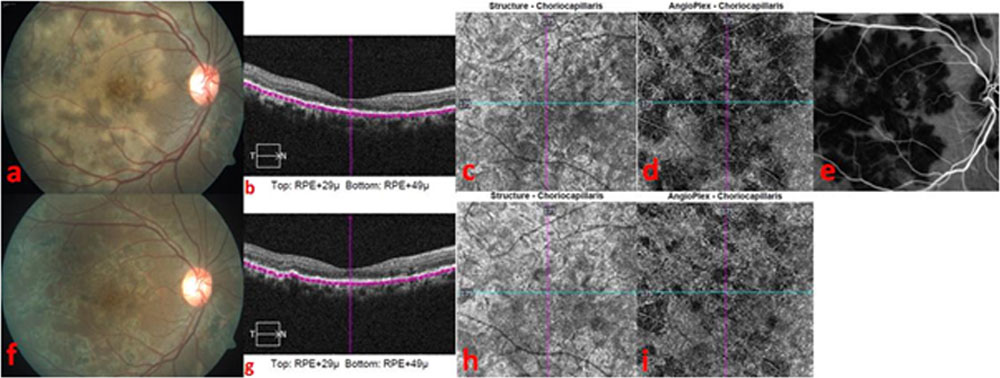
The OCTA and ICGA of patient in Fig. 1a. Note that ICGA (e) hypocyanescence corresponds well with the areas of apparent flow void on OCTA angiographic image (d). However, on one-to-one correlation with OCT B-scan (b) and en face structural image (c), these areas of apparent flow void have decreased signal transmission. After treatment, there is an apparent reperfusion of the flow void areas (i), but one-to-one correlation with en face structural image (h) demonstrates improvement in signal transmission.
Fig.5: Multimodal imaging in a resolved case of serpiginous choroiditis
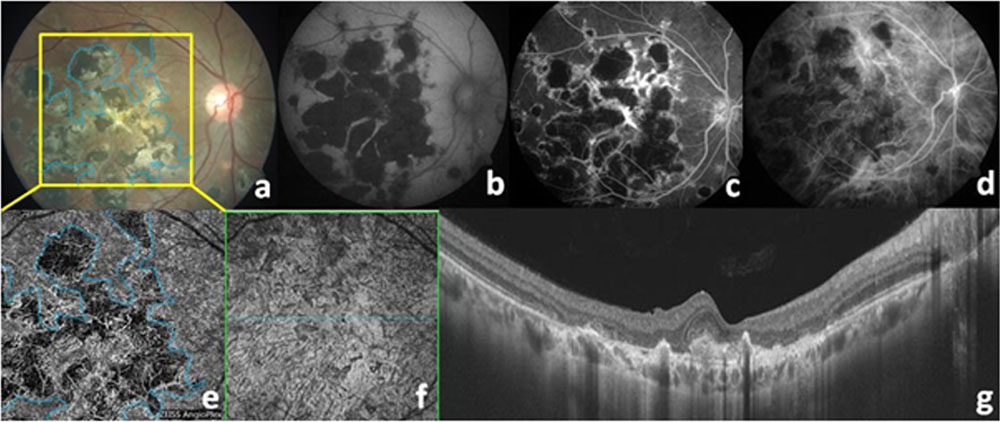
Note the areas of choriocapillaris loss on OCTA en face angiographic images (e, blue outline), even in presence of adequate signal transmission on structural OCTA (f). The OCT B-scan(g) shows thinning of the choriocapillaris which corroborates the fact that there is actual choriocapillaris atrophy.
Fig. 6: Detection of a leaking Choroidal neovascular network on multimodal imaging in a healed case of serpiginous choroiditis
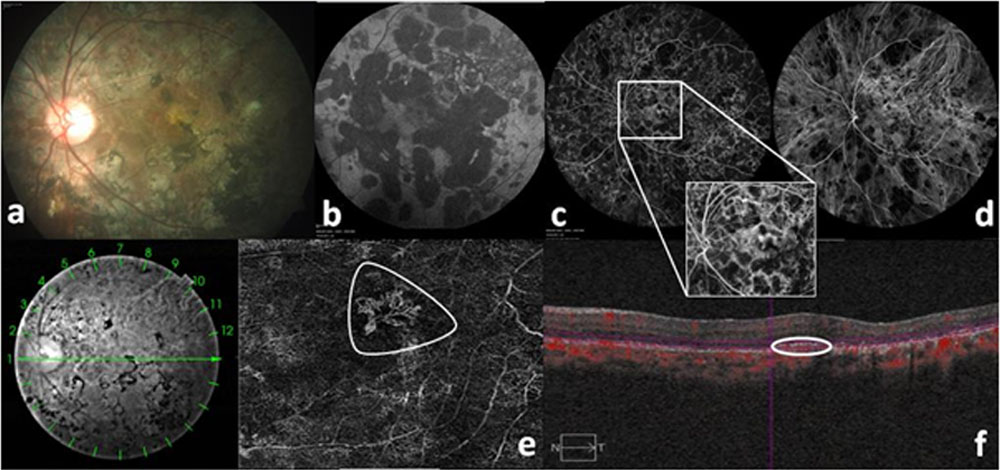
Amidst areas of extensive scarring, fibrosis and varying degrees of pigmentary changes in this 35-year-old with resolved serpiginous choroiditis (a), , the FA detected a small leak near the fovea (c, enlarged in inset). A sea fan choroidal neovascular network was identified at the outer retinal slab on OCTA (e, white polygon) corresponding to the OCT B scan (f, white oval)
Leave a Comment