

Dr.SAURABH RAMUKA,Dr.Rohit Shetty,Dr.LALGUDI GANESH VAITHEESWARAN,Dr.RAVISH GHANSHYAM VAISHNAV
Institution:
Narayana Nethralaya, Bangalore, India
Introduction:
The distribution of epithelium across the cornea might play an important role in keratoconus(KC).
The study developed novel index using zernike analysis of 3-Dimentional epithelium thickness to differentiate forme-fruste keratoconus(FFKC), keratoconus(KC) and normal. The Zernike coefficients for thickness distribution were computed and analyzed.
Aim:
To develop a novel index using Zernike analysis of 3-dimensional epithelium thickness distribution to differentiate forme-fruste keratoconus (FFKC), keratoconus (KC) from normal.
Methods:
- 25eyes with forme-fruste keratoconus, 25 eyes with keratoconus and 25 normal eyes underwent ASOCT (RTVue-100,Optovue Inc., CA). The anterior and bowman’s surface edge was detected in all the 8 radial scans of 6mm diameter.
- The 3-D map of epithelium thickness was generated by interpolating thickness between the radial scans.The map was divided into 2 concentric rings of 2 mm (central zone) and 5 mm diameter. The 2-5 mm zone was further divided into 6 sectors.
- The variables similar to OCT report were calculated, which included mean thickness, minimum and maximum thickness of 5mm zone; average thickness in central zone and each of the 6 sectors of 2-5 mm zone.
- This study is not just limited to calculate thickness in zones similar to OCT. Additional to this, the study has presented a comprehensive glance at epithelium distribution across cornea by using Zernike analysis.
- The mean epithelium thickness in OCT report and computed was similar. A novel index was derived via zernike analysis: (Z).
The study has presented the comprehensive glance at distribution of epithelium across cornea by using Zernike analysis (upto 6th order).
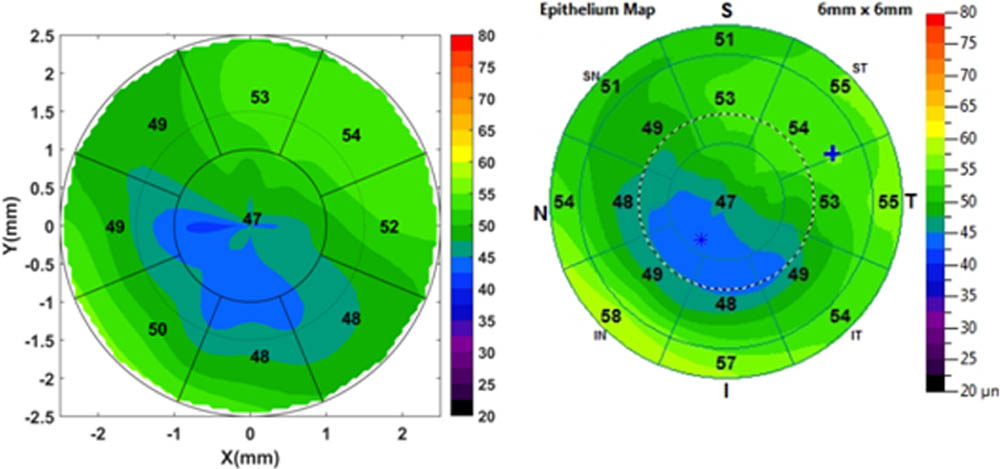
Generated by algorithm Generated by OptoVue
Results:
The mean epithelium thickness derived was similar (p>0.05) to thickness in OCT generated report.
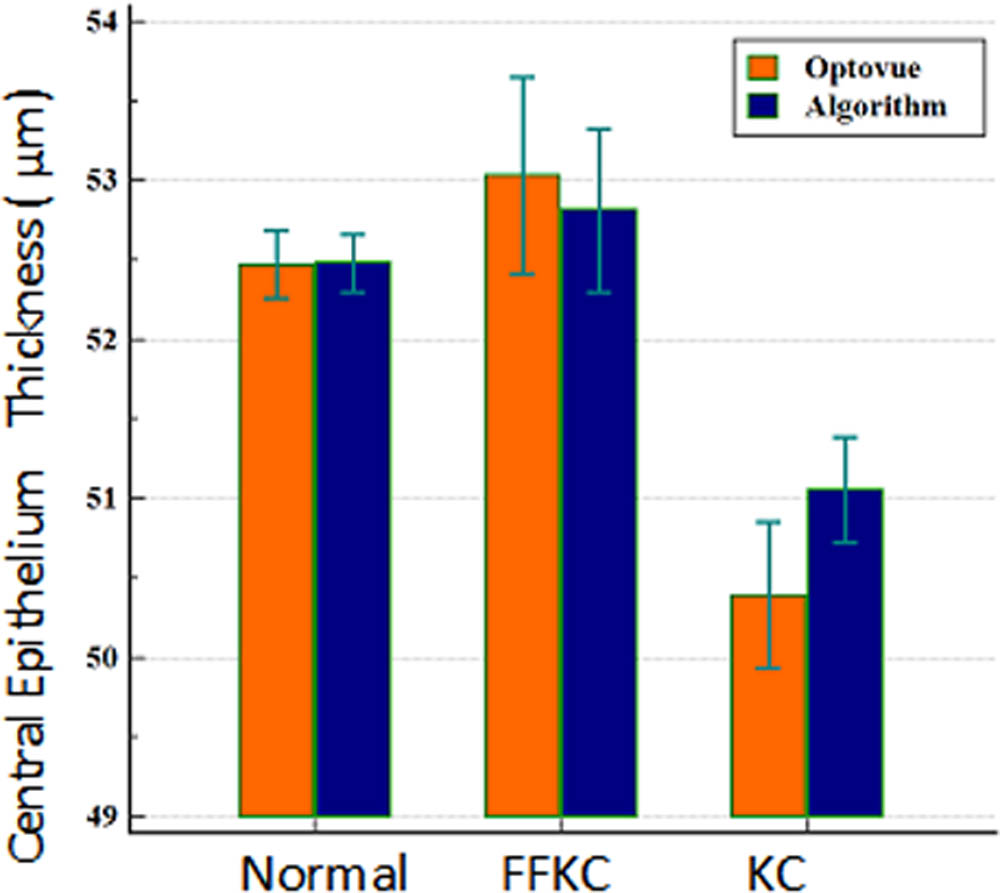
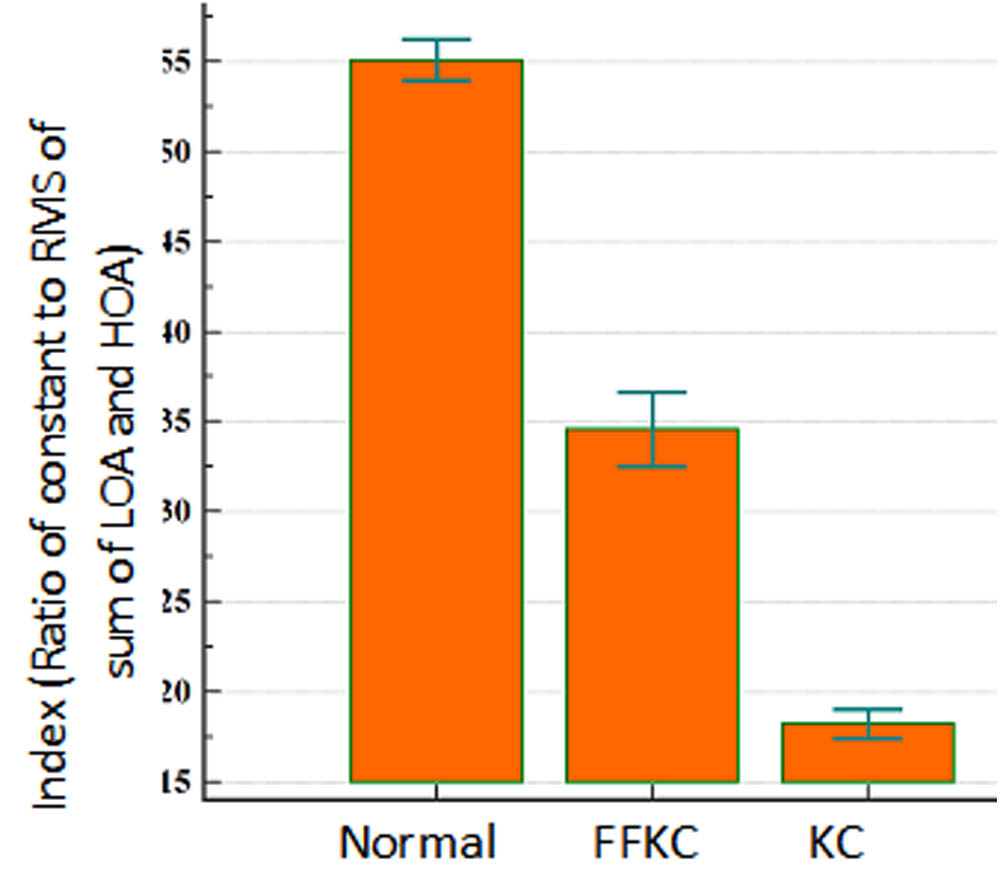
Ratio of constant to root mean square of sum of higher and lower order aberrations was calculated from Zernike analysis of epithelium thickness.
This index was significantly different (p<0.002) between normal (49.1±6.1), forme-fruste keratoconus (23.1±6.8) and keratoconus (17.8±2.4) eyes.
| Normal | FFKC | KC | |
| K max @ anterior surface (D) | 44.33 ± 0.11 | 45.26 ± 0.26 | 53.75 ± 0.59 |
| K max @ bowman’s surface (D) | 44.28 ± 0.11 | 46.22 ± 0.3 | 56.09 ± 0.61 |
| RMS of Coma (µm) | 0.25 ± 0.0 | 0.65 ± 0.06 | 1.34 ± 0.07 |
| RMS Total (µm) | 1.11 ± 0.03 | 1.84 ± 0.11 | 3.41 ± 0.13 |
| Index | 55.01 ± 1.13 | 34.60 ± 2.08 | 18.25 ± 0.81 |
Conclusion:
A novel index based on epithelium thickness was developed to effectively differentiate forme-fruste keratoconus from normal.Longitudinal studies are necessary to assess the usefulnessof the index.
This is the first study to present index based on Zernike analysis of epithelium thickness distributionwith clinical ability to discriminate disease.
References:
- Huang D et al. Distinguishing between contact lens warpage and ectasia: Usefulness of optical coherence tomography epithelial thickness mapping. JCRS 2017.
- MataliaH et al. Noncontact Quantification of Topography of Anterior corneal surface and Bowman’s Layer With High-Speed OCT. JRS2017
Leave a Comment