

Dr. SABYASACHI CHAKRABARTY, Dr. Anirban Dutta, Dr. Fathima A, Dr. Meenakshi Ravindran
Abstract
AIM:
Evaluation of the causes of blindness and low vision in a blind school in a tier III city, to assist in the planning of low vision services.
METHODS:
A cross-sectional survey was carried out among the pupils aged 6 to 16 years, attending a blind school. Their demographic details were obtained from the school records and by interviewing the staff. They were examined by ophthalmologists and trained mid-level ophthalmic personnel. The degree of their visual impairment, the major anatomical site of vision loss and the probable aetiology was recorded according to the World Health Organisation (WHO) defined criteria.
RESULTS:
Out of 149 students, 133 patients fulfilled the WHO criteria. Out of them, 42.86% (n=57) had low vision and 57.14% (n=76) were blind. The mean age of the students was 12.13 ± 3.16 years. The majority of the students were males (n=91; 61.1%). Avoidable blindness accounted for 36.09% (n=48) cases. The major preventable cause of vision loss was trauma (n=6; 4.5%) and the major treatable causes were lens-related (n=27; 20.30%). The major anatomical sites of vision loss were developmental malformations (29.32%; n=39), lens-related anomalies (20.30%; n=27) and retinal pathologies (17.29%; n=23). Miscellaneous causes (such as phthisis, nystagmus etc) accounted for 19.55% (n=26) cases. The aetiologies of blindness were mixed with a predominance of hereditary and undetermined causes (n=120; 90.2%).
CONCLUSION:
These demographics stress on the need for robust community screening, strengthening of primary eye-care services and the need to develop specialised paediatric eye-care services in the management of childhood blindness.
Keywords :-
Blind school survey, childhood blindness, avoidable blindness, treatable blindness, preventable blindness.
Body
Introduction
Childhood blindness, although uncommon, is a huge social burden because of the large number of “blind years” it generates. The aetiology of childhood blindness and its prevention strategies vary with the socio-economic characteristics of a population. Population-based data on childhood blindness is difficult to obtain because these entail evaluation of large samples. Blind school surveys are perhaps the only feasible ways to obtain the profile of childhood blindness, but they have an inherent selection bias. Nonetheless, this study hopes to provide a glimpse of the characteristics of childhood blindness in the South Indian population.
Methods
A single blind school located in Palayamkottai (an urban locality in Tirunelveli district) was surveyed on a single day (04th December, 2016). Prior permission for examination was obtained from the principal of the said blind school. Ethical clearance was obtained from the Institutional Ethics Committee of Aravind Eye Hospital, Tirunelveli. The survey adhered to the tenets of the declaration of Helsinki.
Demographic data of the children and a brief family history were obtained from the school records and the staff. A detailed ophthalmic examination was done by an ophthalmologist and two mid-level ophthalmic personnel trained in refraction and low vision assessment. Distance visual acuity was assessed by AUROCHART© (Aurolab, Madurai, India), which is a self-illuminated electronic Snellen’s acuity chart, placed at a distance of three metres from the child. It was placed in a make-shift dark room to avoid background glare. Distance refraction was done by loose-lens retinoscopy. The objective values obtained were refined subjectively. The spherical component was refined by a bracketing method using ± 2.0 D, ± 1.0D and ±0.5 D lenses. The astigmatic component was refined using a Jackson’s cross cylinder (± 1.0 D for those with vision worse than 6/36 and ± 0.5 D for the others). The axis was bracketed to within 10º steps and the amount to within ± 1.0 D.
If the child failed the distance vision test but there appeared to be some useful vision left, tests for functional vision (independent mobility, social contact and near vision) were done.1 All tests for functional vision were done with both the eyes open. “Independent mobility” was assessed by asking the child to navigate unassisted between two chairs kept two metres apart in a well-lit room. “Social contact” was defined by the child’s ability to identify known faces from a distance of two metres. “Near vision” was assessed by asking the child to describe or identify three 5 mm symbols from a near distance. The near distance was not specified to encourage the child to adopt his/her normal head posture. Children with no functional vision were referred to the base hospital for cane training.
Tests for low vision aids (LVA) were performed for all patients with low vision with at least some functional vision. The LVAs tested were high plus lenses, hand magnifiers, stand magnifiers and spectacle mounted magnifiers. Each child was given a choice of two LVAs and their uses were demonstrated. The ultimate choice of LVA depended upon the near visual acuity and the child’s ease of use.
Anterior segment evaluation was carried out with torchlight. Fundus evaluation, if indicated, was done using an indirect ophthalmoscope after full mydriasis. Any condition which required further evaluation or treatment was referred to the base hospital. The ophthalmologist recorded the major site of abnormality responsible for the vision loss using the WHO classification system.2 When the major anatomical site of abnormality was different in the two eyes, the eye with the preventable or treatable cause was selected. If neither eye had a treatable or a preventable abnormality, the eye with the better vision was selected.
Continuous variables were summarised as mean and standard deviation. Categorical variables were summarised as frequency and percentage The data thus collected was analysed using OpenOffice Calc for Windows (version 4.1.4).
Results
A total of 149 children were examined in the blind school. A total of 91 students (61.1%) examined were males. The mean age of the examined students was 12.13 ± 3.16 years (range = 6 – 16 years). The levels of visual acuity of all the children attending the blind school have been summarized in table 1 according to the WHO disability categories. According to WHO criteria, 42.86% (n=57) had low vision and 57.14% (n=76) were blind.
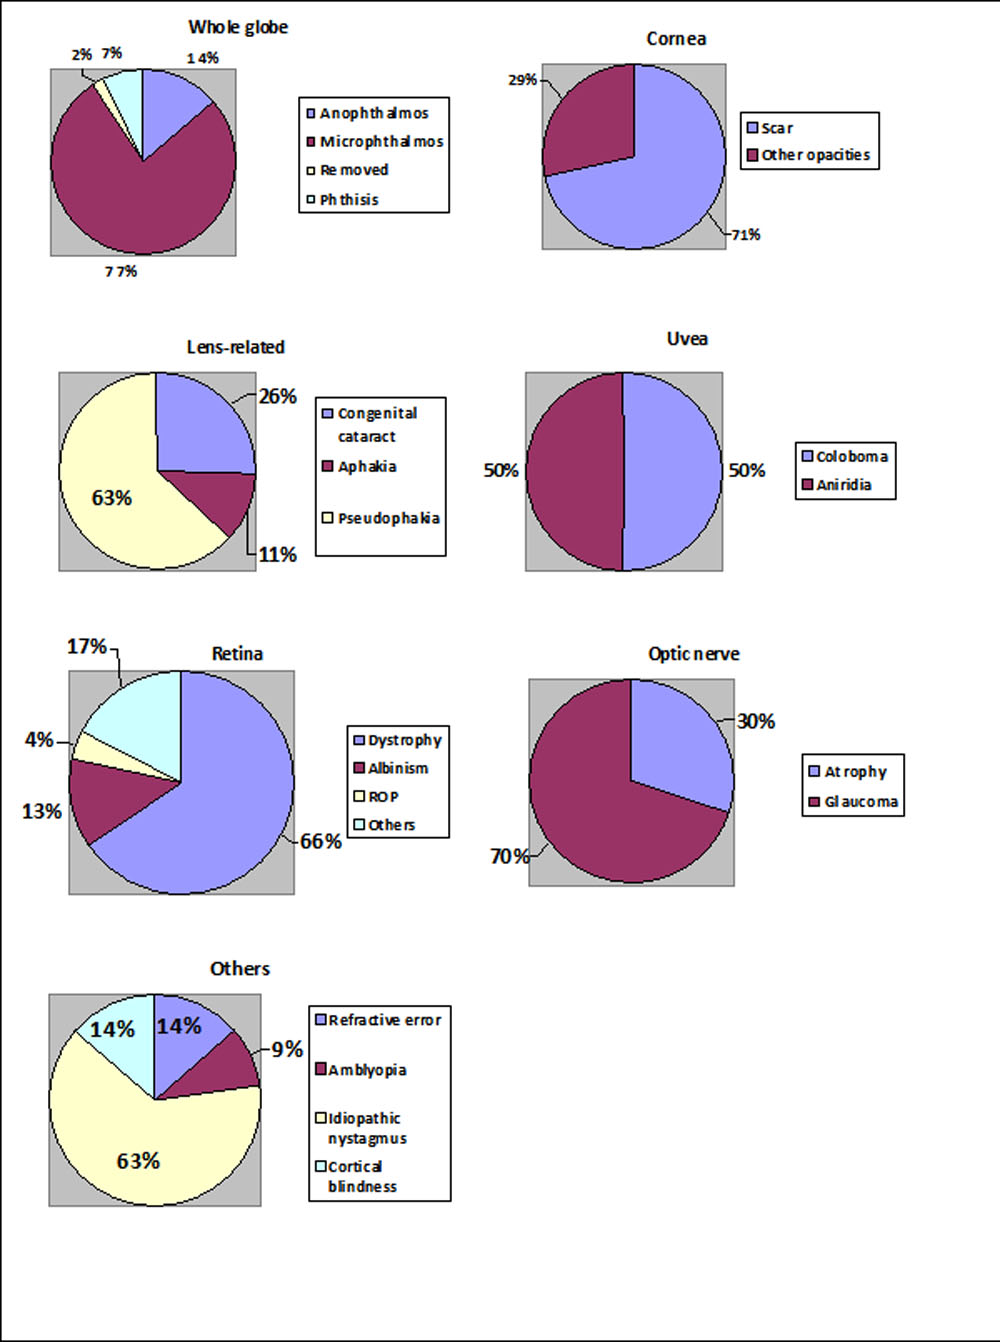
In the 133 children who had visual impairment, the major anatomical site of visual impairment was recorded. Table 2 shows the distribution of visual impairment according to the major anatomical site. Chart 1 elaborates the major anatomical site for each class. The commonest causes of low vision and blindness were developmental malformations (29.32%; n=39), lens-related anomalies (20.30%; n=27) and retinal pathologies (17.29%; n=23). Miscellaneous causes (such as phthisis and pre-phthisis, nystagmus etc) accounted for 19.55% (n=26) cases.
The aetiologies of visual impairment are listed in table 3. Abnormality since birth (n=39; 29.3%) and hereditary factors (n= 28; 21.1%) were responsible for a majority of cases. There was a single case of ROP blindness.
In our survey, 36.09% (n=48) of the blindness was avoidable. The preventable causes noted were ametropic and stimulus-deprivation amblyopias, congenital rubella syndromes and trauma. The treatable causes included glaucoma, cataract, pseudophakia with dense amblyopia, refractive error and ROP. Table 4 summarises the causes of avoidable blindness in our study.
Discussions
The development of any control programme for prevention of childhood blindness involves identification of the causes of avoidable blindness in a given populace and monitoring their trend over time. There is a genuine lack of data regarding childhood blindness in the Indian population. Population based surveys are improbable and blind school surveys are not very accurate. This is because children attending these special schools may not be representative of the total number of blind children in the entire population. This is especially true for children with additional disabilities and those coming from poorer socio-economic backgrounds. Approximately, 60 – 80% of the children die within two years of becoming blind.3 Moreover, it is believed that only 10% of the blind children in a population attend these special schools.4 Despite these shortcomings, valuable data can be obtained from blind school surveys.
This blind school survey has been carried out in a very unique location, a tier III city which is the headquarter of the Tirunelveli district. Although, Tirunelveli is drained by the river Thamirabarani and its tributaries, the supply of water for irrigation is restricted to only a few areas of Ambasamudram and Cheranmahadevi blocks. This results in an agriculture characterised by a single crop, providing employment for only few months in a year. Thus there is abject poverty and backwardness in this location.5 This blind school serves this whole district. This gives rise to very specific patterns in the students attending the blind school.
A majority of the examined children were males (n=91; 61.1%). This preponderance of males over females has been reported in other contemporary studies as well. This may simply reflect a social bias towards educating males rather than a chromosomal difference in the prevalence of blindness.6
A total of 133 children (89.3%) were visually impaired (ranging from low vision to total blindness) while 16 children (10.7%) had no visual impairment. Sia et al in their survey of four blind schools in Cambodia, reported that 7.4% of the children had a best corrected visual acuity better than 6/18.7 This appears to completely contradict the basic ideals of a blind school where only those who are visually impaired should be educated. The cause of this disparity in our case was not very difficult to find. Two of these children had post traumatic phthisis in one eye, one child had an enucleated globe and three children had ametropic amblyopia. All these children had mild mental retardation for which they had not been accepted in a normal school. In all the rest of the patients, there was visual impairment not severe enough to be classified as Category I, associated with a physical impairment (six children had hearing difficulties and the rest had limb abnormalities). Their parents had tried to get them enrolled in normal schools but they had been unable to adjust there. Moreover there are very few special schools for children with other disabilities in the region. Hence they had been allowed to stay back. Addressing this problem may actually reduce the burden on blind schools.
Developmental anomalies accounted for a majority of the vision loss (n=39; 29.32%). One may speculate that a majority of these anomalies are due to a genetic disorder which is common in these parts because of the practice of consanguineous marriages in this area. An adverse interaction between genes controlling retinoic acid signalling and maternal Vitamin A deficiency in the early foetal period may be responsible.8 A high rate of whole globe abnormalities has been reported from other blind school surveys as well.9-14 Blindness due to lens related anomalies (20.30%; n=27) and retinal disorders (17.29%; n=23) were other major contributors. A similar proportion of lens-related abnormalities has been reported from Cambodia (27.4%) and Malaysia (22.3%).7,15 In another study from South India the incidence of blindness due to retinal dystrophies has been reported to be 17.1% which is very similar to ours.8 Overall, the proportion of corneal blindness was very low (n=7; 5.3%). This may be because of a good coverage by immunisation.
Overall, the aetiologies were mixed with a predominance of hereditary and undetermined causes. A major limitation of our study was that we could not interview the parents or examine them, which would have played a pivotal role in classifying the children with glaucoma and cataract into the appropriate inheritance categories. Thus, in spite of a high prevalence of consanguinity in this population, hereditary diseases contributed to only 21.1% (n=28) of childhood visual impairment. Further research is needed to elaborate on the aetiologies of childhood visual impairment in this population.
In this study 36.09% (n=48) children were found to have an avoidable visual loss. Congenital cataract is usually the most common surgically correctable cause of childhood blindness. But, in this study, this was not the most common cause of visual impairment. Early detection and treatment could have responsible for this disparity. Out of the 7 children with unoperated cataract, only one was operable and was sent to the base hospital for further management. In all the rest, the cataract was either partly absorbed or there was no perception of light. Although the proportion of congenital glaucomas was much higher than that reported in the general population (5.3% versus 1 in 10000),16 it is difficult to state whether this is a definite trend or a manifestation of Berksonian bias. Refractive errors (n=3; 2.3%) and amblyopias (n=5; 3.8%) as causes of avoidable blindness simply indicate a lack of awareness among the general population regarding routine ophthalmological evaluation in children. Cicatriceal ROP was seen in only 1 case (0.8%). This may simply reflect high infant mortality rates where ROP is rarely seen due to the scarcity of neonatal care facilities.
In conclusion, the pattern of childhood blindness seen in this survey is similar to that shown in previous ones despite the unique socio-economic characteristics of the studied region. The prevalence of preventable blindness can be reduced by strengthening the primary level services. But the prevalence of treatable blindness can only be reduced by improving paediatric ophthalmology services in the area with a comprehensive approach which should include early referral and rehabilitation facilities.
References
- Silver J, Gilbert CE, Spoerer P, Foster A. Low vision in east African blind school students: need for optical low vision services. Br J Ophthalmol 1995;79:814-20.
- Gilbert C, Foster A, Negrel AD, Thylefors B. Childhood blindness: a new form of recording causes of visual loss in children. Bull World Health Organ 1993;71(5):485-9.
- Lewallen S, Courtright P. Blindness in Africa: present situation and future needs. Br J Ophthalmol 2001; 85:895-903.
- Gilbert C, Foster A. Childhood blindness in the context of Vision 2020 – the right to sight. Bull World Health Organ 2001;79:227-32.
- State Planning commission Tamil nadu. District Human Development Report – 2017 Tirunelveli District. Tamil Nadu; 2017:7-8.
- Gilbert CE. Changing challenges in the control of blindness in children. Eye 2007; 21:1338-43.
- Sia DIT, Muecke J, Hammerton M, Ngy M, Kong A, Morse A, et al. A survey of visual impairment and blindness in children attending four schools for the blind in Cambodia. Ophthalmic Epidemiol. 2010 Aug;17(4):225-33. doi: 10.3109/09286586.2010.489250.
- Krishnaiah S, Subba Rao B, Lakshmi Narasamma K, Amit G. A survey of severe visual impairment in children attending schools for the blind in a coastal district of Andhra Pradesh in South India. Eye(Lond) 2012 Aug; 26(8):1065-70.
- Rahi JS, Gilbert CE, Foster A, Minassian D. Measuring the burden of childhood blindness. Br J Ophthalmol 1999; 83:387-8.
- Dandona L, Williams JD, Williams BC, Rao GN. Population based assessment of childhood blindness in southern India. Arch Ophthalmol 1998;116:545-6.
- Titiyal JS, Pal N, Murthy GVS, Gupta SK, Tandon R, Vajpayee RB et al. Causes and temporal trends of blindness and severe visual impairment in children in schools for the blind in North India. Br J Ophthalmol 2003;87:941-5.
- Gogate P, Deshpande M, Sudrik S, Taras S, Kishore H, Gilbert C, et al. Changing patterns of childhood blindness in Maharashtra, India. Br J Ophthalmol 2007;91:8-12.
- Hornby SJ, Adolph S, Gothwal VK, Gilbert CE, Dandona L, Foster A. Evaluation of children in six blind schools in Andhra Pradesh. Ind J Ophthalmol 2000; 48:195-200.
- Sil AK, Gilbert CE. Childhood blindness in India. J Ind Med Assoc 2001;99:10-5.
- Reddy SC, Tan BC. Causes of childhood blindness in Malaysia: results from a national study of blind school students. Int Ophthalmol 2001;24(1):53-9.
- Francois J. Congenital glaucoma and it’s inheritance. Ophthalmologica 1972;181:61-73.
Table 1 Levels of visual impairment in the 149 children surveyed
| Vision | WHO category | n | % | 95% confidence interval | |
| Upper limit | Lower limit | ||||
| 6/6-6/18 | No Impairment | 16 | 10.7 | 5.7 | 15.7 |
| <6/18 – 6/60 | 1 | 32 | 21.4 | 14.8 | 28.1 |
| <6/60 – 3/60 | 2 | 25 | 16.8 | 10.7 | 22.8 |
| <3/60 – 1/60 | 3 | 12 | 8.1 | 3.7 | 12.5 |
| <1/60 – PL | 4 | 52 | 34.9 | 27.2 | 42.6 |
| No PL | 5 | 12 | 8.1 | 3.7 | 12.5 |
| Total | 149 | 100 | |||
Table 2 The major anatomical site of involvement for visual impairment.
| Anatomical site | Number | Percentage |
| Whole globe | 42 | 31.6 |
| Cornea | 7 | 5.3 |
| Lens related | 27 | 20.3 |
| Uvea | 2 | 1.5 |
| Retina | 23 | 17.3 |
| Optic nerve | 10 | 7.5 |
| Others | 22 | 16.5 |
| Total | 133 | 100 |
Table 3 Aetiologies of visual impairment
| Serial Number | Cause | Number | Percentage |
| 1 | Heriditary | 28 | 21.1 |
| Autosomal dominant | 7 | 5.3 | |
| Autosomal recessive | 5 | 3.8 | |
| Cannot specify | 16 | 12.0 | |
| 2 | Intrauterine factor | 2 | 1.5 |
| Rubella | 2 | 1.5 | |
| 3 | Perinatal/neonatal factor | 4 | 3.0 |
| Cerebral hypoxia/ injury | 3 | 2.3 | |
| ROP | 1 | 0.8 | |
| 4 | Post natal/ childhood/ infancy | 7 | 5.3 |
| Neoplasm | 1 | 0.8 | |
| Trauma | 6 | 4.5 | |
| 5 | Undetermined | 92 | 69.2 |
| Cataract | 20 | 15.0 | |
| Glaucoma | 7 | 5.3 | |
| Abnormality since birth | 39 | 29.3 | |
| Others | 26 | 19.5 | |
| Total | 133 | 100 |
Table 4 Avoidable causes of vision loss
| Serial Number | Causes | Number | Percentage |
| 1 | Preventable causes | 13 | 9.8 |
| Ametropic amblyopia | 2 | 1.5 | |
| Stimulus-deprivation amblyopia | 3 | 2.3 | |
| Rubella | 2 | 1.5 | |
| Trauma | 6 | 4.5 | |
| 2 | Treatable causes | 35 | 26.3 |
| Glaucoma | 7 | 5.3 | |
| Cataract | 7 | 5.3 | |
| Pseudophakia + amblyopia | 17 | 12.8 | |
| Refractive error | 3 | 2.3 | |
| ROP | 1 | 0.8 | |
| Total | 48 | 36.09 |
Chart 1 Pie diagrams showing the distribution of 133 children with visual impairment according to the major anatomical site of involvement.
Leave a Comment