

Dr.Priyanka Raut
Dr.Mohini Singh,Dr.NIKHILESH ANIL WAIRAGADE,Mrs.MARY JENIFA TIGGA
Authors:
- Priyanka. P. Raut, DOMS DNB, Consultant
- Chitra Pande, MS, Associate Professor, Sr. Oculoplasty Consultant
- Nikhilesh Wairagade, MS FICO, FNAMS, Medical Superintendent, Sr. Cornea specialist
- Sneha Gabhane, DNB
Affiliation: Mahatme Eye Bank Eye Hospital, run by SMM eye Welfare Charitable Trust, Nagpur.
ABSTRACT
PURPOSE:
To compare immersion ultrasound biometry and optical biometry based on partial coherence interferometry (PCI) in calculating IOL power preoperatively and refractive outcomes (in spherical equivalent) postoperatively in patients undergoing phacoemulsification.
MATERIALS AND METHODS:
Patients undergoing phacoemulsification were randomly divided in two groups with regard to the IOL power calculation method. Biometry based on partial coherence interferometry was done by optical biometer (AL-Scan; Nidek Co., Ltd.). Ultrasound biometry was done by ultrasonic immersion biometer (Alcon, OcuScan RXP). Optical biometry was performed prior to ultrasound biometry to avoid corneal contact, which may affect reading. Keratometry values were taken from optical biometer in both the groups. IOL power was calculated using modified SRK II formula and desired post-op refraction was decided prior to surgery. Differences between desired and achieved refractions were then compared.
RESULTS:
Total 180 eyes were included in study, 90 eyes in each group. The mean age was 61.9 ± 6.8 years in immersion ultrasound (US) biometry group and 63 ± 5.5 years in optical biometry group (P=0.24). The Immersion US biometry group had 51.1% males (46 males) and 48.9% females (44 females) whereas optical biometry group had 65.6% males (59 males) and 34.4% females (31 females) (P=0.07).
Mean axial length (AL) by immersion biometry was 23.08 ± 0.61 mm, while by optical biometry, mean AL was 23.17 ± 0.62 mm (P=0.19) with mean difference of 0.09 ± 0.11. Mean pre-operative IOL power by immersion biometry was 21.36 ± 1.57D and by optical biometry, it was 20.98 ± 1.58D (P= 0.02) with mean difference of 0.38 ± 0.41. Thus, optical biometry measures slightly longer AL and less IOL power for desired post-operative refraction. Mean Final achieved refraction in immersion biometry group was -0.53 ± 0.53 and in optical biometry, it was -0.37 ± 0.26(P=0.02).
In immersion biometry group, 50 % (45 eyes) had refraction within 0.25D while in optical biometry group, 73.3% (66 eyes) had refraction within 0.25D of desired refraction (<0.0001). In immersion biometry group, 78.9 % (71 eyes) had refraction within 0.5D while in optical biometry group, 100% (90 eyes) had refraction within 0.5D (<0.0001). In immersion biometry group, 96.7 % (87 eyes) had refraction within 1D while in optical biometry group, 100% (90 eyes) had refraction within 1D (P=0.25).
CONCLUSION:
Pre-operative AL measurements by optical biometry were slightly higher than immersion biometry group. Pre-operative IOL power values by optical biometry were slightly lesser than immersion biometry group for the desired post-operative refraction. Post-operative refractive outcome in optical biometry were closer to target refraction as compared to immersion ultrasound biometry. Thus, optical biometry improves the predictive value of postoperative refraction in eyes undergoing cataract surgery with patient’s spherical equivalent more likely to be closer to their target refraction.
INTRODUCTION
The International Agency for the Prevention of Blindness estimates that out of every 5 blind or visually impaired people, 4 have avoidable causes; and preventable causes are as high as 80% of the total global visual impairment burden (285 million people).(1) Worldwide, 39 million are blind and 246 million have low vision (severe or moderate visual impairment).(1) Cataract, presents a significant public health challenge being one of the most common eye diseases(2) and a leading cause of blindness worldwide,(3) accounting for approximately 50% or 20 million people of the global burden of blindness.(4) Cataract is also responsible for a visual acuity of 6/60 or worse in more than 100 million eyes.(5)
Cataract removal and intraocular lens implantation is one of the most frequently performed and successful ophthalmic surgical procedures. Owing to the high rate of success, cataract surgery is being viewed as a refractive surgery with a target of unaided visual acuity being 6/6 for distance and N6 for near vision
Over the years, development of biometry, phacoemulsification, and intraocular lens (IOL) power calculation enabled precise prediction of postoperative refractory status(6). Premium accommodative, toric, aspheric, and multifocal intraocular lenses (IOLs) are now widely available. There is an increased quest for accuracy, and patients are now seeking better results.
The refractive outcomes following phacoemulsification cataract surgery depend upon a number of factors like axial length measurements, keratometry, anterior chamber depth, IOL power formulae, and quality of IOL. Among these factors, axial length plays the main role in determining postoperative refraction. Axial length error of 100 µm translates to a postoperative refraction error of 0.28 diopters.(7)
Until recently, axial length was measured by using ultrasound technique, which uses the echo delay time to measure intraocular distances. It has a longitudinal resolution of 200 µm and an accuracy of 100-120 µm in measuring axial lengths. It involves passing an ultrasonic beam via transducer through the eye, and as this is returned after hitting intraocular structures, a trace of ocular spikes is displayed on the monitor from cornea to the orbital fat.(8)
In applanation ultrasound technique, there is contact with the cornea that can lead to indentation and axial length measurement error of 0.1 to 0.3 mm. There is also a risk of corneal epithelial injury, and infection, besides patient discomfort.(9) So, immersion ultrasound technique was introduced where direct contact with cornea is avoided. In this technique, by placing a scleral shell filled with saline between the probe and the eye, corneal indentation is prevented. It is relatively observer-dependent and has a disadvantage of inter-observer error.
To overcome this limitation, a partial coherence interferometer (PCI), which is based on the principle similar to that of optical coherence tomography, was introduced. PCI uses 780µm light wave that has eight to nine times the resolution of 10 MHz sound wave. Being non-applanation type, it has the advantage of giving the patient less discomfort and has a low interobserver error.(10–13) Commonly used PCIs in the clinical setting include the IOL Master (Carl Zeiss Meditiec, Jena, Germany) and Lenstar (Haag Steit AG, Koeniz, Switzerland). Multiple studies are available showing that the PCI technique has similar or greater accuracy compared to the conventional ultrasound techniques.(10,14,15)
Recently, the new PCI AL-scan (Nidek, Gamagori, Japan) has been introduced and increases precision by using a 3-dimentional ocular tracking technique. It uses PCI and scheimpflug imaging techniques to measure axial length, corneal refractive power, anterior chamber depth, central corneal thickness, white-to-white distance, and pupil size in a single sitting. Based on those values, IOL power is calculated using onboard software.
The purpose of this study was to compare two methods of IOL power calculation preoperatively, and to evaluate the refractive results and accuracies achieved using PCI technique by AL-scan (optical biometry) comparing it with conventional ultrasound biometry by immersion method (immersion biometry).
MATERIALS AND METHODS
In this prospective, randomized, comparative study, patients attending OPD of Mahatme Eye Bank Eye Hospital, Nagpur who underwent phacoemulsification during the period from 1st April, 2016 to 31st March, 2017 were enrolled and followed up for 1 month. The study protocol was reviewed and approved by the Institutional Ethics Committee.
Sample size was decided using n Master version 2.0 based on the study conducted by Beatriz Machado Fontes et al.(18) Zα/2 (the critical value of the Normal distribution at α/2), and Zβ (the value obtained from standard normal distribution related to the chosen level of power)(22) were derived. The values of p1 and p2 were obtained from the study conducted by Beatriz Machado Fontes et al.(18) Considering 5% level of significance (type I error) and 80% statistical power, and using the formula for difference of proportion, the sample size was estimated to be 76 in each group. Considering 20% loss to follow-up, 180 eyes were enrolled in the study, 90 in each group, one group undergoing IOL power implantation based on IOL calculation with immersion ultrasound biometry and the other group with optical biometry (PCI). IOL power to be implanted was the power closest to -0.5 dioptres (D) refraction in both the group.
Patients meeting inclusion criteria were evaluated in detail after taking informed consent for the study and procedure. Patients were randomized with the help of a randomization table generated from the website www.randomization.com, to undergo IOL implantation based on IOL power calculation with immersion biometry or optical biometry.
Group I : Immersion ultrasound biometry (Immersion Biometry)
Group II : Partial coherence interferometry (Optical Biometry)
They were examined on day 1, day 8, day 30 and findings were entered in a prewritten standardized proforma.
Inclusion criteria were patients older than 40 years of age of either sex, patients with axial length between 22 to 24.50 mm, patients who are having uncomplicated cataract, patients who are able to give consent and willing for follow up, and patients who underwent no previous ocular surgery. Our exclusion criteria were patients with axial length more than 24.50 mm or less than 22 mm, patients with mature cataracts, dense cataract, posterior sub-capsular cataract, patients with traumatic cataract, patients with intra-operative complications such as hyphaema, zonular rupture, posterior capsular rupture etc., patients with ocular co-morbidities such as corneal degeneration and dystrophies, dry eye, corneal opacities and scarring, advanced glaucoma, uveitis, retinal abnormalities involving the central retina, optic nerve diseases.
Detailed history regarding any pre-existing ocular inflammations and all the aforesaid ocular and systemic conditions in the inclusion and exclusion criteria was taken. Measurement of uncorrected (UCVA), with pin hole (PHVA) and best corrected visual acuity (BCVA) for distance and near using LogMAR chart was done. Detailed ophthalmological examination was done using slit lamp. Dilated fundus examination using +90D and +20D was done. Pre-operative tonometry with non-contact tonometer, patency of the lacrimal passage was tested. Biometry based on partial coherence interferometry was done by optical biometer (AL-Scan; Nidek Co., Ltd.). Ultrasound biometry was done by ultrasonic immersion biometer (Alcon, OcuScan RXP). Optical biometry was performed prior to ultrasound biometry to avoid corneal contact, which may affect reading. Keratometry values were taken from optical biometer in both the groups. AL and IOL power was calculated by both the methods in all 180 eyes. Difference between AL measurement and IOL power measurement between both the groups were then compared. IOL calculations were carried out by the same person in both the groups. The modified SRK-II formula was used to calculate the IOL power in all the patients. The desired postoperative refraction was decided prior to surgery. Patients underwent phacoemulsification surgery after biometry. All the surgeries were performed by a single surgeon.
At each of these follow up visits, the uncorrected visual acuity and the best corrected visual acuity for distance was recorded using LogMAR chart. The final post-operative refractive outcome which is to be compared amongst two different methods was taken at the end of 4 weeks. The postoperative refraction was carried out with an auto-refractor as well as retinoscopy and that was be confirmed by subjective refraction. The difference between desired final refraction and achieved final refraction for two methodologies was compared. Spherical equivalent in diopters was used for programmed final refraction and achieved final refraction.
Statistical analysis was performed using JMP Pro version 12.0.1, © SAS Institute Inc and Microsoft Excel 2013. Descriptive statistics are presented as means, percentages and standard deviations.Visual acuity was calculated using Logarithm of the Minimum Angle of Resolution (LogMAR) for statistical evaluation. Fisher’s exact test was used for categorical variables and non-parametric Wilcoxon Rank sums test was used for continuous variables, as it precludes any assumption about normal distribution of data. P values were considered statistically significant at <0.05 level
RESULTS
180 eyes of 133 patients were included in this study, 90 eyes each in the two groups, group I (Immersion biometry) and group II (optical biometry). Table 1 and figure 1 shows the age distribution in the two groups. The mean age was 61.9 ± 6.8 years in group I and 63 ± 5.5 years in group II (P=0.24).97 (53.88 %) cases in our study were in the range of 61 to 70 years; with a mean age of 62.48 ± 6.2 years.
Table 1: Age distribution of cases in both groups.
| Immersion Biometry | Optical Biometry | |||
| Number | % | Number | % | |
| 41-50 | 6 | 6.7% | 0 | 0% |
| 51-60 | 32 | 35.6% | 30 | 33.3% |
| 61-70 | 43 | 47.8% | 54 | 60.0% |
| 71-80 | 9 | 10.0% | 6 | 6.7% |
| Mean Age (Years) | 61.9 | 63.0 | ||
| Standard deviation | 6.8 | 5.5 |
Figure 1:
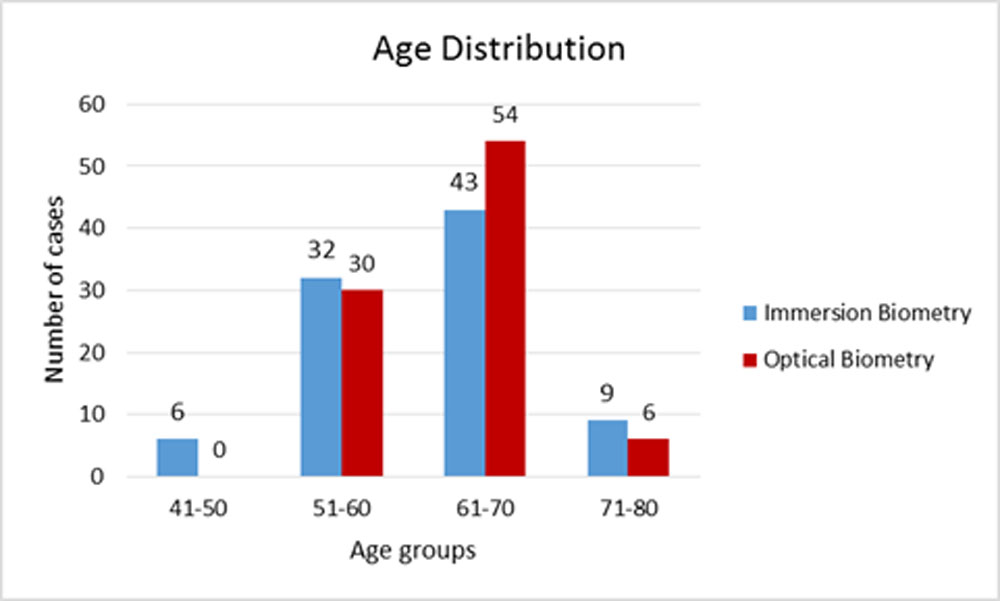
Table 2 and figure 2 shows the percentage distribution of gender in both the groups. Group I had 51.1% males (46 males) and 48.9% females (44 females) whereas Group II had 65.6% males (59 males) and 34.4% females (31 females) (P=0.07).
Table 2: Gender Distribution of cases in both groups
| SEX | Immersion Biometry | Optical Biometry | ||
| N | % | N | % | |
| Females | 44 | 48.9 | 31 | 34.4 |
| Males | 46 | 51.1 | 59 | 65.6 |
| TOTAL | 90 | 100 | 90 | 100 |
Figure :2
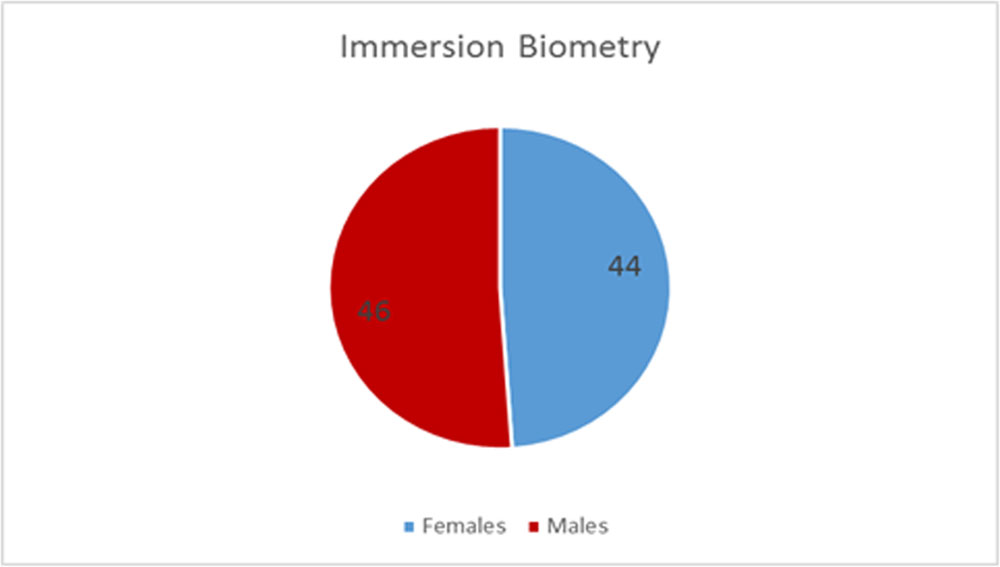
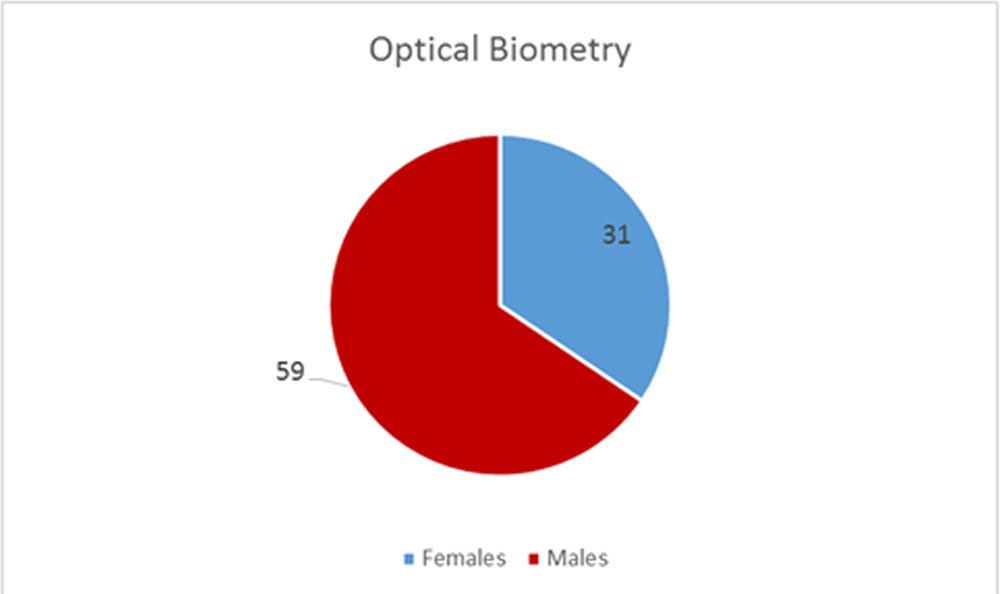
Table 3 and figure 3 shows the distribution of the operated eyes within the two groups in the study. In immersion biometry group, 53 right eyes were operated, 37 eyes were left eyes. In optical biometry group, 43 of the eyes operated were right eyes, and 47 of the eyes operated were left eyes (P=0.18).
Table 3: Operated Eye
| EYE | Immersion Biometry | Optical Biometry | ||
| N | % | N | % | |
| Right Eye | 53 | 58.9 | 43 | 47.8 |
| Left Eye | 37 | 41.1 | 47 | 52.2 |
| TOTAL | 90 | 100 | 90 | 100 |
Figure 3:
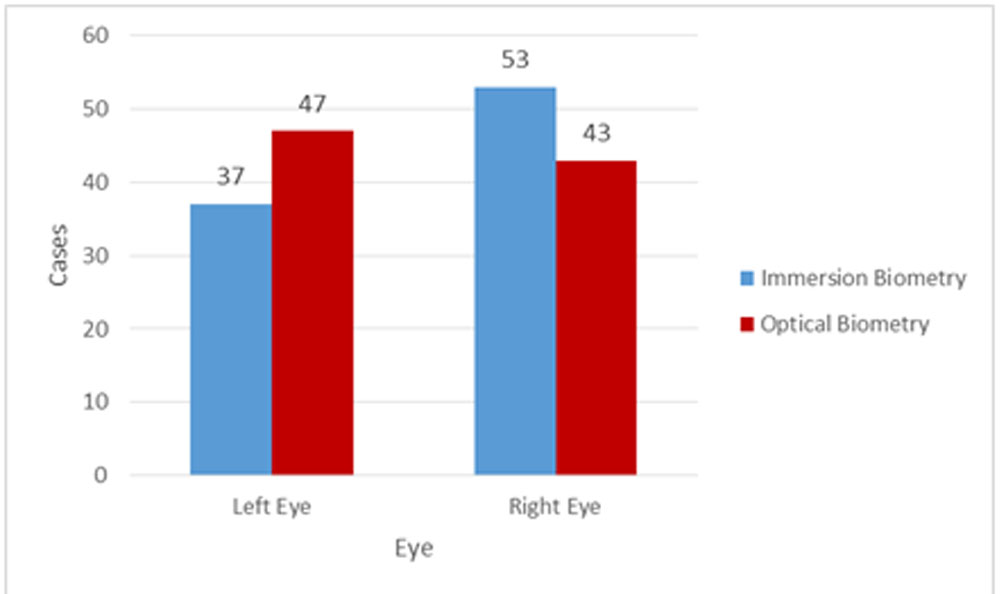
Table 4 and figure 4 show the diagnosis in the two groups studied. In our study, the predominant type of cataract was NS2+CC which accounted for 33.3 % (30 eyes) in immersion biometry group and 41.1 % (37 eyes) in optical biometry group.
Table 4: Lens grade
| Immersion Biometry | Optical Biometry | |||
| N | % | N | % | |
| NS 1 + CC | 6 | 6.7 | 3 | 3.3 |
| NS 2 | 21 | 23.3 | 20 | 22.2 |
| NS 2 + CC | 30 | 33.3 | 37 | 41.1 |
| NS 3 | 15 | 16.7 | 14 | 15.6 |
| NS 3 + CC | 16 | 17.8 | 16 | 17.8 |
| NS 4 | 2 | 2.2 | 0 | 0.0 |
| Total | 90 | 100 | 90 | 100 |
Figure 4:
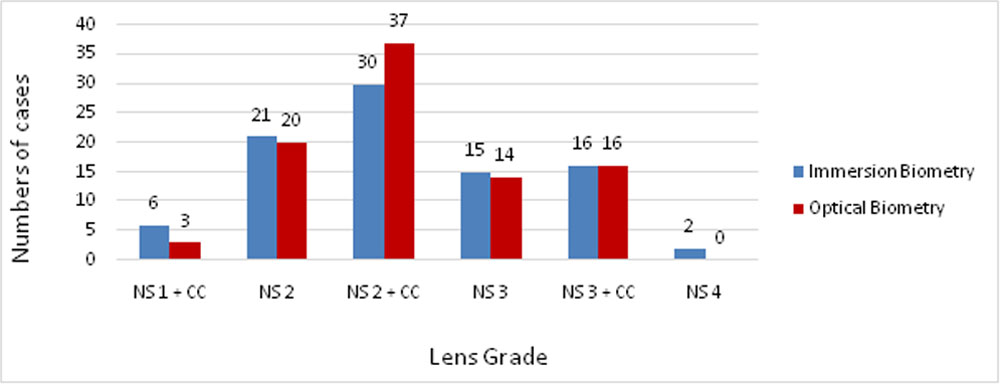
Figure 5 shows axial length distribution in both the groups. Mean axial length in immersion biometry group was 23.08±0.61 mm, while in optical biometry group, mean AL was 23.17±0.62mm. Figure 6 shows IOL power measurement in both the groups. Mean IOL power in immersion biometry group was 21.36 ± 1.57 mm, while in optical biometry group, mean IOL power was 20.98 ± 1.58 mm.
Figure 5: axial length measurement
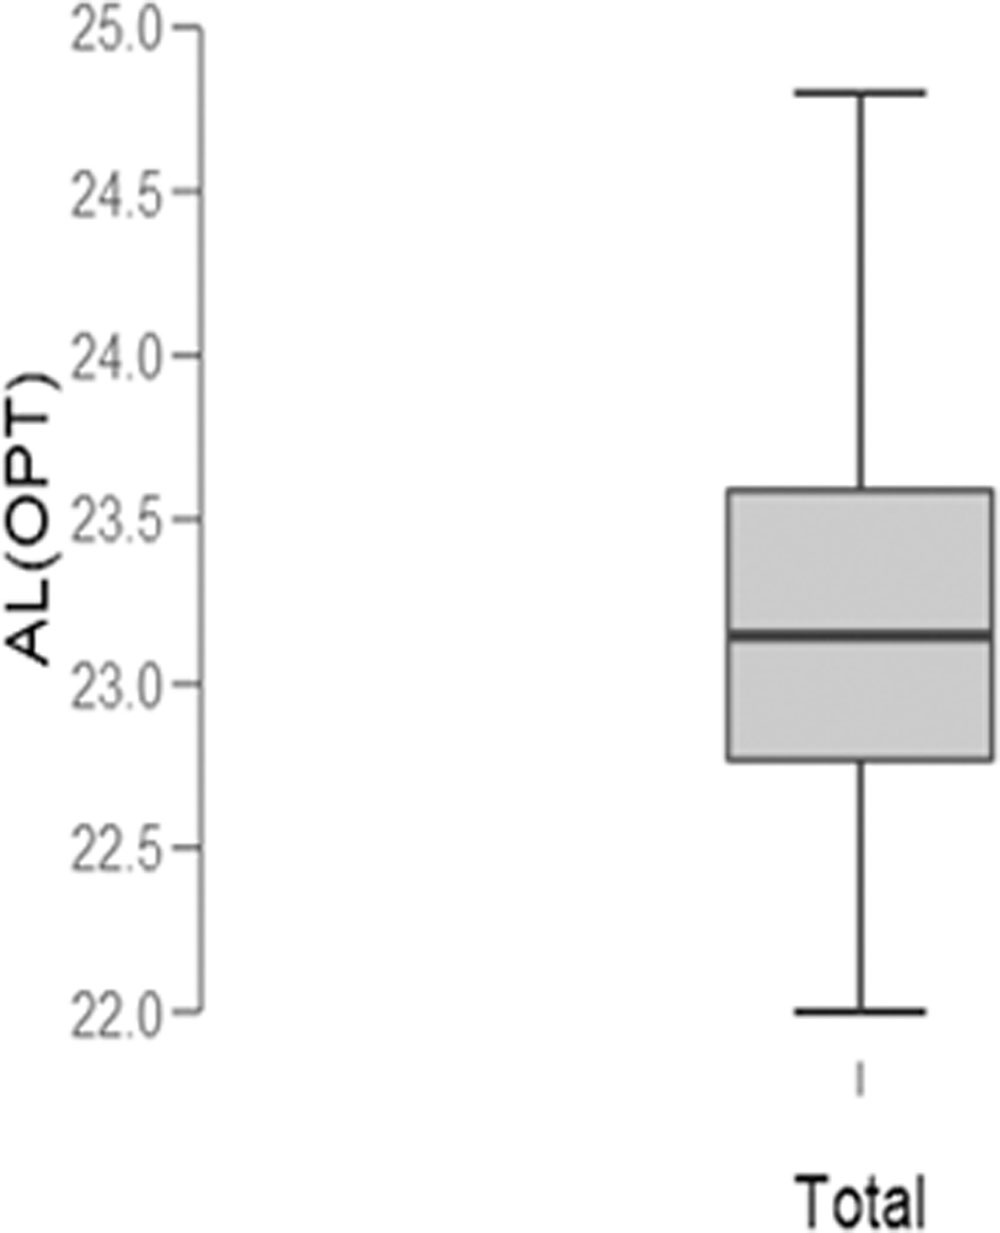
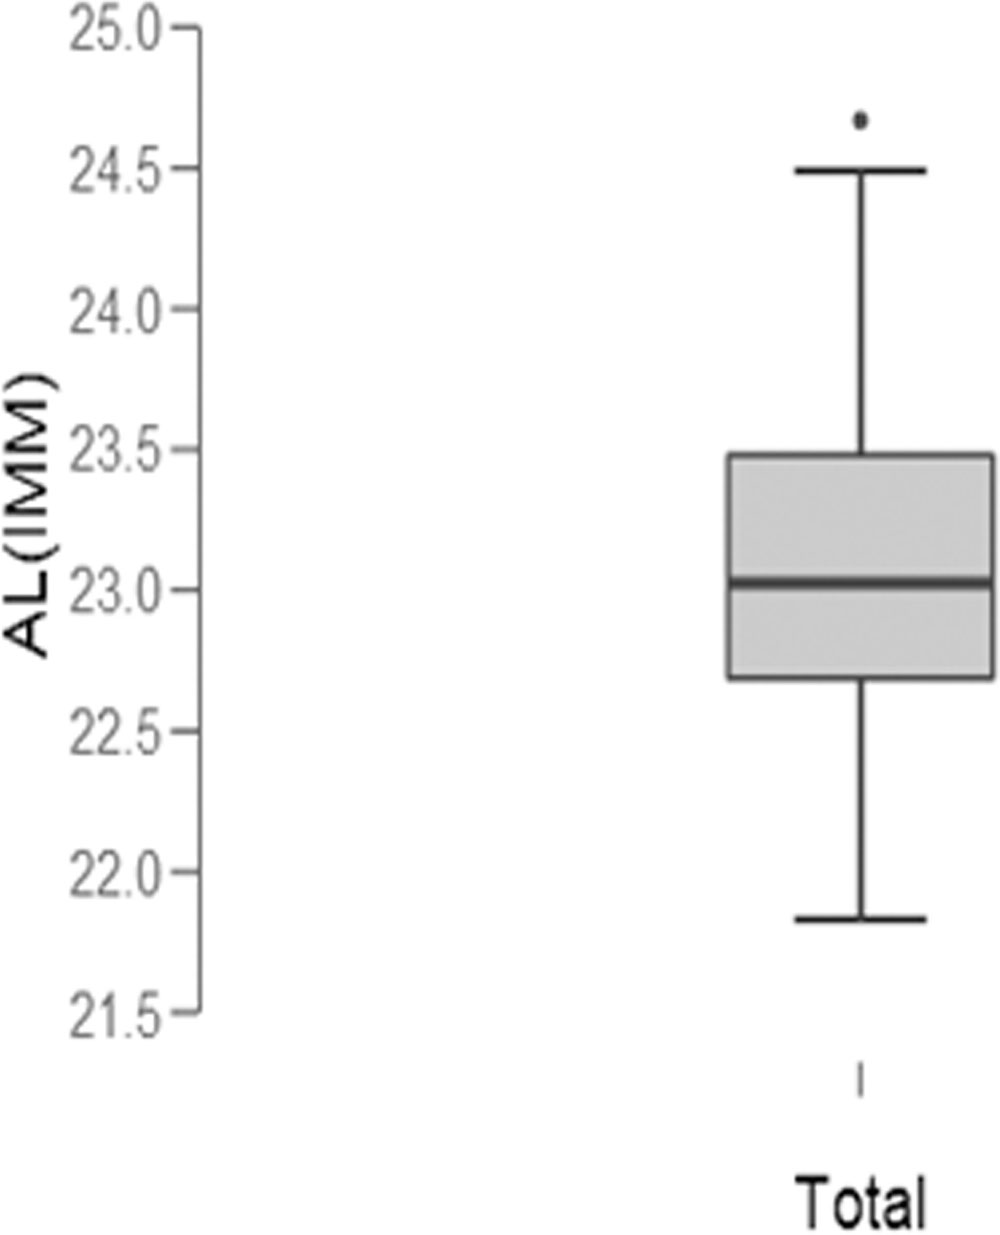
Figure 6: IOL (IMM vs OPT)
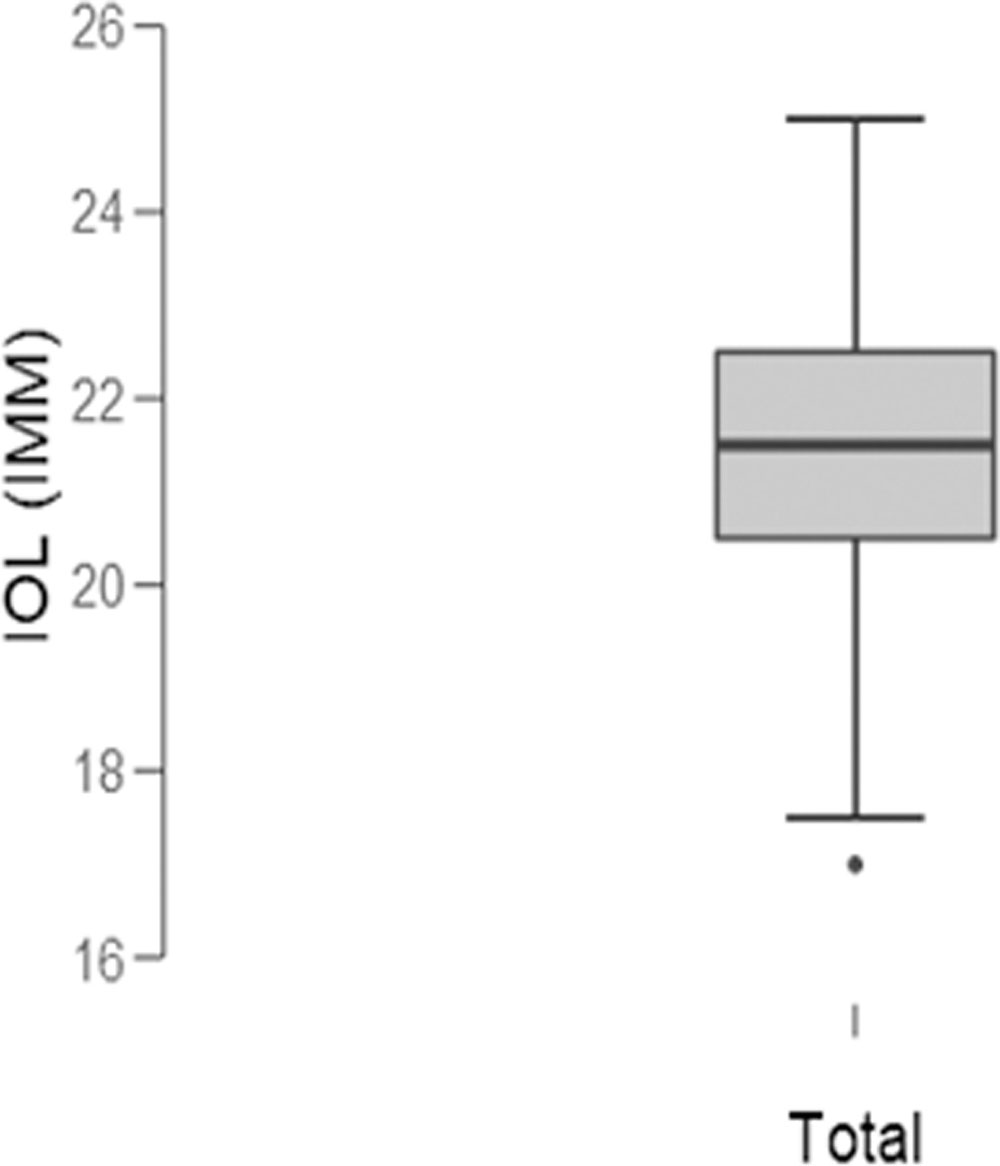
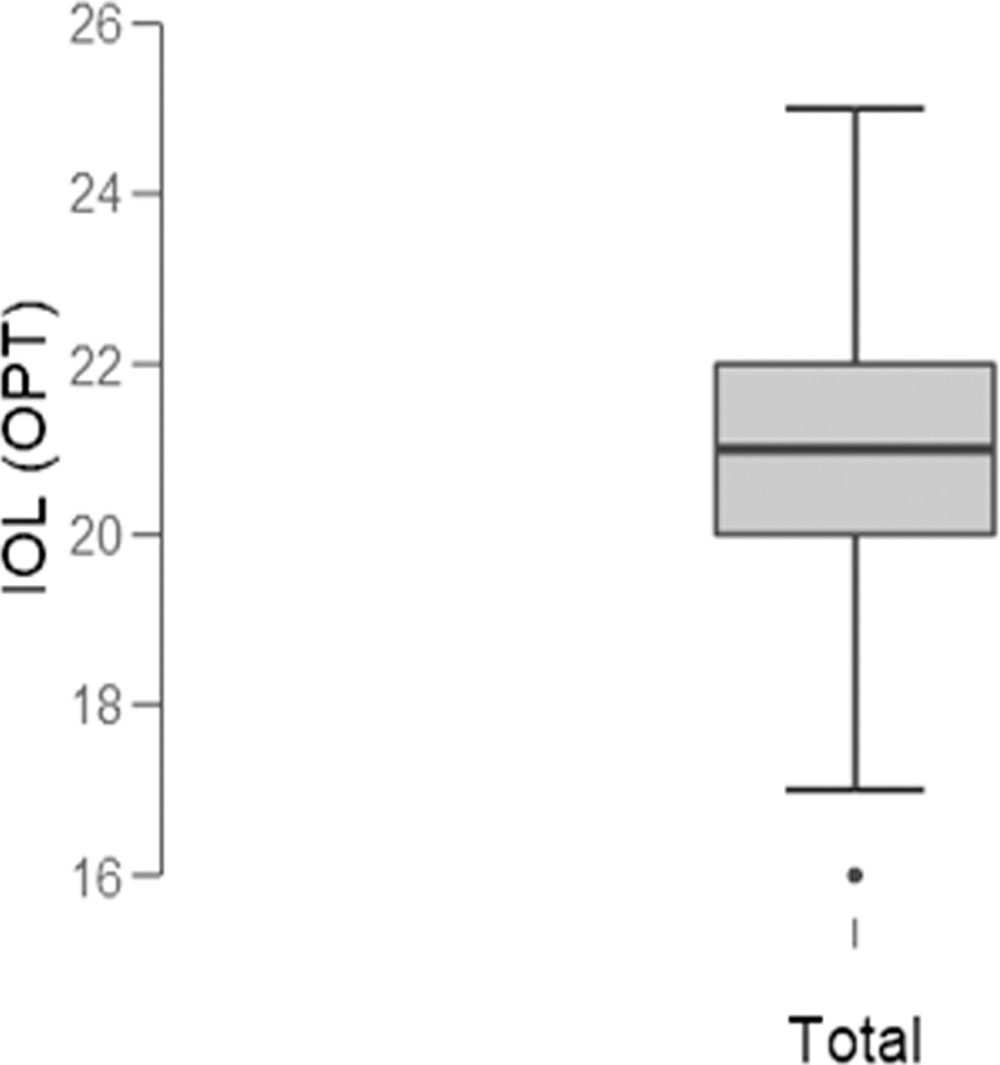
Figure 7 shows the comparative evaluation of UCVA from baseline to the end of the study (30 days post-op) in both the groups. In immersion biometry group , the mean baseline UCVA was 0.66 ± 0.21 logMAR which improved to 0.24 ± 0.16 logMAR at the end of the study, which was strongly significant (P= <0.0001). In optical biometry group, the mean baseline UCVA was 0.68 ± 0.21 logMAR which improved to 0.17 ± 0.11 logMAR at the end of the study, which was strongly significant (p= <0.0001).
Figure 7 : Trend in visual acuity findings in both groups
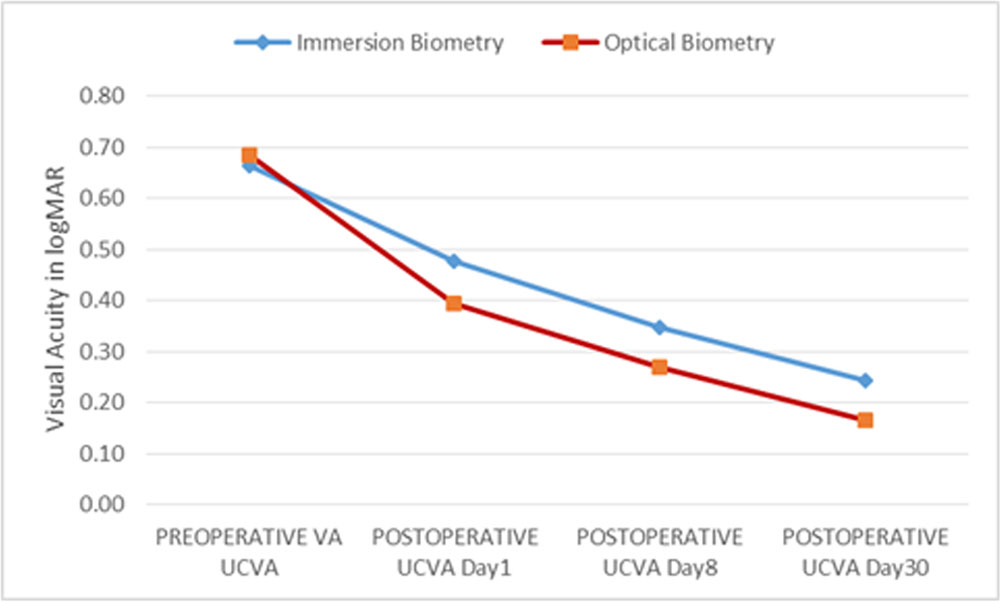
In immersion biometry group, mean pre-op UCVA was 0.66 ± 0.21, whereas in optical biometry group , mean pre-op UCVA was 0.68± 0.21. (P= 0.59). The mean post-op UCVA on day 1 was 0.48 ± 0.13 in immersion biometry group whereas 0.39 ± 0.11 in optical biometry group(P< .0001). On day 8, the mean post-op UCVA in immersion biometry group was 0.35 ± 0.14 as compared to optical biometry group where it was 0.27 ± 0.10(P=0.0001). On day 30, in immersion biometry group, the mean post-op UCVA was 0.24 ± 0.16 as compared to optical biometry group which was 0.17 ± 0.11 (P= 0.0006).
Table 5 and figure 8 show the comparative evaluation of BCVA from baseline to the end of the study (30 days post-op) in both the groups. In immersion biometry group, the mean baseline BCVA was 0.21 ± 0.13 LogMAR which improved to 0.07 ± 0.08 LogMAR at the end of the study, which was strongly significant [p <0.0001]. In optical biometry group, the mean baseline BCVA was 0.23 ± 0.15 LogMAR which improved to 0.02±0.04 LogMAR at the end of the study, which was strongly significant [p <0.0001].
In immersion biometry group, mean pre-op BCVA was 0.21 ± 0.13, whereas in optical biometry group, mean pre-op BCVA was 0.23± 0.15(P= 0.81).The mean BCVA on day 1 was 0.29 ± 0.13 in immersion biometry group whereas 0.17 ± 0.07 in optical biometry group. (P< 0.0001)
On day 8, the mean BCVA in immersion biometry group was 0.16 ± 0.12 as compared to the optical biometry group where it was 0.06 ± 0.06. (P< 0.0001). On day 30, in immersion biometry group, the mean BCVA was 0.07 ± 0.08 as compared to optical group which was 0.02 ± 0.04. (P<0.0001)
Table 5: Best Corrected Visual Acuity
| BCVA | Group I | Group II | P value |
| Pre op | 0.21±0.13 | 0.23±0.15 | 0.81 |
| Day 1 | 0.29±0.13 | 0.17±0.07 | <.0001 |
| Day 8 | 0.16±0.12 | 0.06±0.06 | <.0001 |
| Day 30 | 0.07±0.08 | 0.02±0.04 | <.0001 |
| Difference from pre-op | |||
| @Day 1 | 0.07 | -0.05 | |
| @Day 8 | -0.05 | -0.16 | |
| @Day 30 | -0.14 | -0.21 | |
| P value from pre-op | |||
| @Day 1 | <.0001 | 0.006 | |
| @Day 8 | 0.005 | <.0001 | |
| @Day 30 | <.0001 | <.0001 |
Figure 8: Best corrected visual acuity
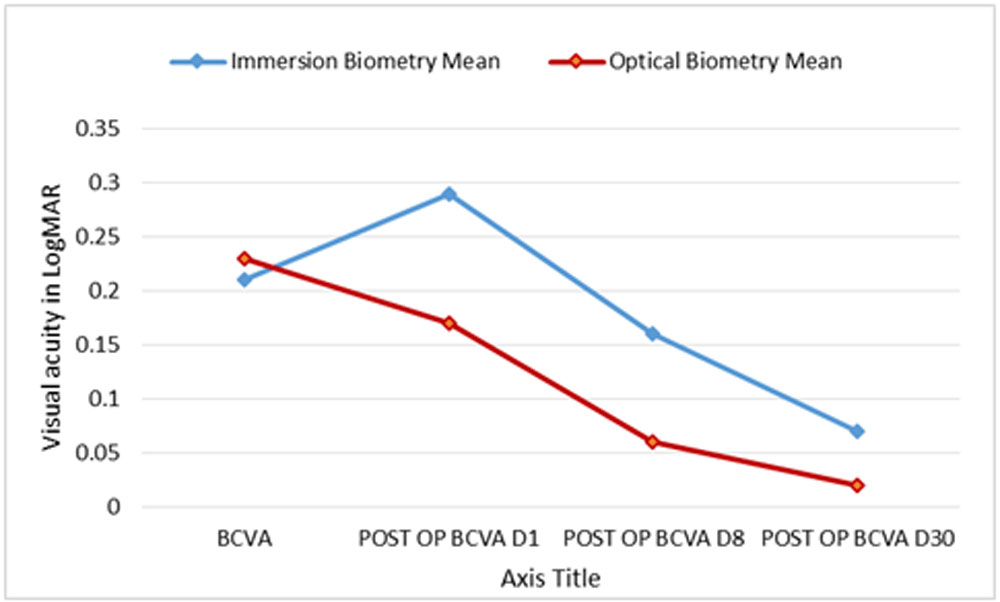
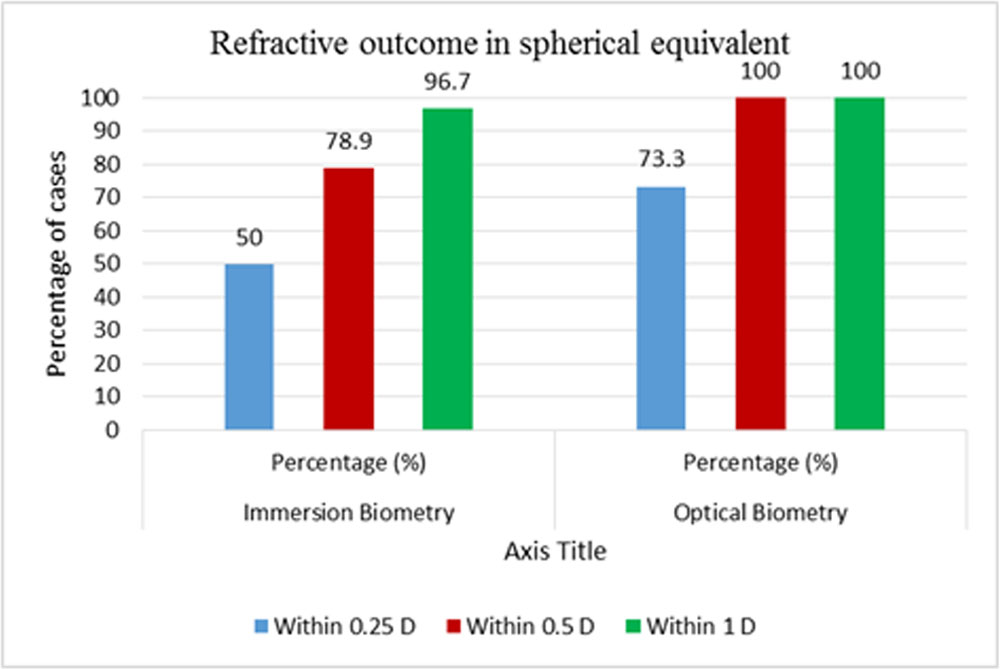
Table 6, 7 and figure 9, 10, 11 show the comparative evaluation of refractive outcome in terms of spherical equivalent at day 30 in both the groups. In immersion biometry group, 50 % (45 eyes) had refraction within 0.25D of desired refraction while in optical biometry group, 73.3% (66 eyes) had refraction within 0.25D of desired refraction.(P = <0.0001). In immersion biometry group, 78.9 % (71 eyes) had refraction within 0.5D of desired refraction while in optical biometry group, 100% (90 eyes) had refraction within 0.5D of desired refraction.(P = <0.0001). In immersion biometry group, 96.7 % (87 eyes) had refraction within 1D of desired refraction while in optical biometry group, 100% (90 eyes) had refraction within 1D of desired refraction.(P= 0.25)Figure 9 shows the final values of achieved postoperative refraction were higher and more hyperopic than the desired refraction in the immersion biometry group (P = 0.54), while there was lesser variability and better match between the desired and final refraction in the optical biometry group (P<0.0001).
Table 6 : Refractive outcome at day 30 in spherical equivalent
| spherical equivalent | Immersion biometry | Optical Biometry |
| -1.75 | 1 | 0 |
| -1.5 | 2 | 0 |
| -1.25 | 10 | 0 |
| -1 | 13 | 2 |
| -0.75 | 12 | 10 |
| -0.5 | 13 | 38 |
| -0.25 | 20 | 18 |
| 0 | 13 | 22 |
| 0.25 | 3 | 0 |
| 0.5 | 1 | 0 |
| 0.75 | 1 | 0 |
| 1 | 0 | 0 |
| 1.25 | 1 | 0 |
Figure 9 :Refractive outcome at day 30 in spherical equivalent
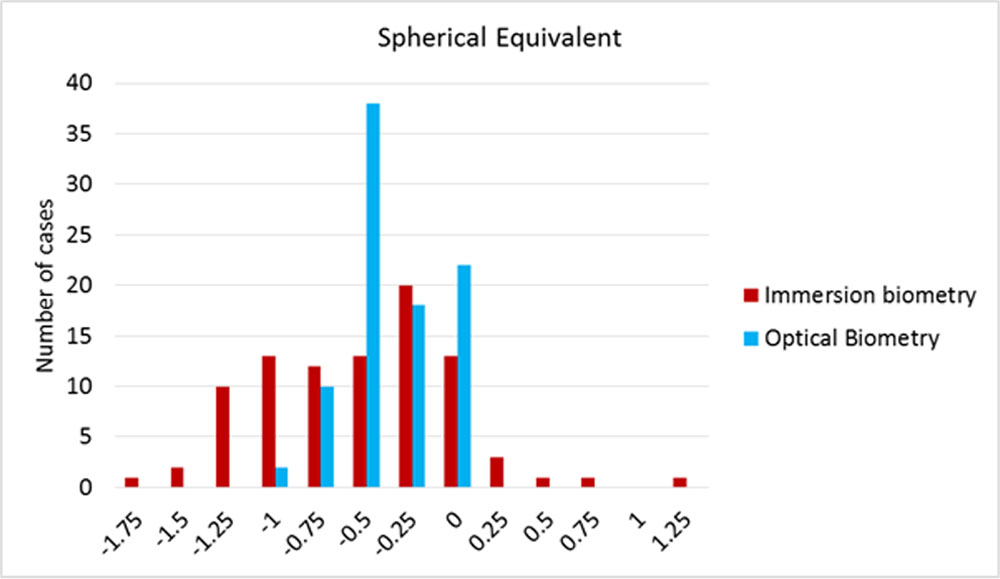
Figure 10: Refractive outcome at day 30 in spherical equivalent
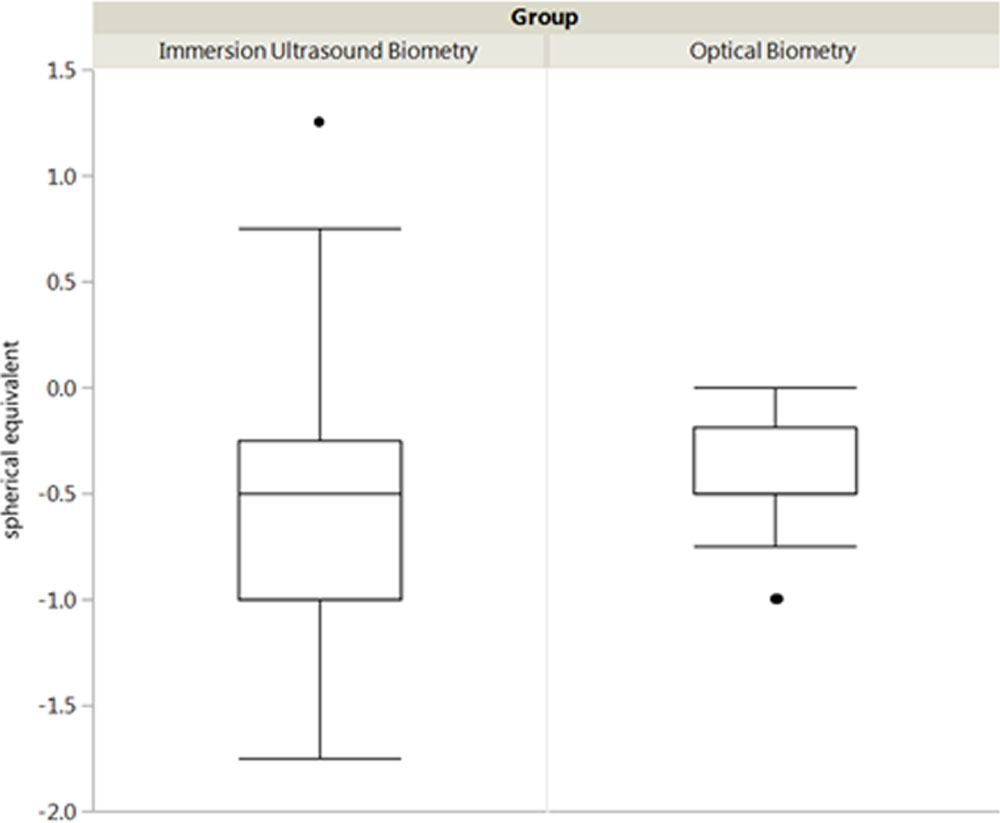
Table 7: Refractive outcome at day 30
| Immersion Biometry | Optical Biometry | ||||
| Number of eyes | Percentage (%) | Number of eyes | Percentage (%) | P value | |
| Within 0.25 D | 45 | 50 | 66 | 73.3 | <0.0001 |
| Within 0.5 D | 71 | 78.9 | 90 | 100.0 | <0.0001 |
| Within 1 D | 87 | 96.7 | 90 | 100.0 | 0.25 |
Figure 11 : Refractive outcome at day 30
DISCUSSION
This was a prospective, randomized study undertaken to compare the refractive outcomes (in spherical equivalent) following IOL power calculation with immersion biometry and optical biometry in patients undergoing phacoemulsification at our institute during the period of April 2016 to March 2017. 180 eyes of 133 patients were included in the study. No serious surgical events occurred and no IOL was explanted. Post-operative refractive outcome in optical biometry were closer to target refraction as compared to immersion ultrasound biometry.
Overall in our study, the age was comparable in both the groups. The overall age profile of our cohort was younger than that in other studies. In a study conducted by Fontes et al.(18) , mean age of patients in the optical biometry group was 69.8 ± 13.1 years and 70.0 ± 9.3 years in the ultrasound group (P=0.7165). In a study conducted by Landers J. et. al.(17), mean age was 76±9.1 years. Fewer females were present in our cohort, similar to the gender profile of patients participating in the study conducted by Landers J. et al(17) (60% males and 40 % females). However, female cases outnumbered male cases in the study conducted by Fontes et al.(18) However, in a study conducted by Serdar Aktas et al(21), the ratio of male and female cases was 1:1.
There was no statistically significant difference in the pre-op UCVA distribution between the two groups (P= 0.59). All eyes in this study had senile immature cataracts. The predominant type of cataract was NS2+CC (nuclear sclerosis with cortical cataract) accounting for 33.3 % (30 eyes) in immersion biometry group and 41.1 % (37 eyes) in optical biometry group, followed by nuclear sclerosis grade 2 (23.33% in Immersion biometry and 22.22% in optical biometry).
Mean keratometry readings in our group were very close to those reported in a study conducted by Landers J. et al(17), where the mean keratometry value was 43.32 ± 1.17D for Humphrey-Zeiss keratometer( for US group) and 43.64 ± 1.15D for optical biometry group.
Fontes et al(18) reported a mean axial length of 23.22 ± 1.06 mm (20.05 – 25.78) in their ultrasound (US) group and a mean AL of 23.22 ± 1.00 mm (range 21.01 – 25.45) in the PCI group (P=0.9110). The mean AL ranges in the study by Landers et. al(17) were not too far off. In the latter study, mean axial length measured by US was 23.25 ± 0.90 mm and that measured by optical biometry was 23.37 ± 0.87 mm. In our study, mean axial length (AL) was 23.14 ± 0.59 mm in immersion biometry group and 23.11 ± 0.62 mm in optical biometry group(P=0.65).
The mean post-op UCVA on day 1 was 0.48 ± 0.13 in immersion biometry group, significantly higher than that in the optical biometry group (0.39 ± 0.11) (P<0.0001). On day 8, the mean post-op UCVA in immersion biometry group was 0.35 ± 0.14 as compared to optical biometry group where it was 0.27 ± 0.10 (P<0.0001) The significant difference in visual outcomes continued till the end of follow-up. On day 30, in immersion biometry group, the mean post-op UCVA was 0.24 ± 0.16 as compared to optical biometry group where UCVA was 0.17 ± 0.11 (P = 0.0006). In immersion biometry group, mean pre-op BCVA was 0.21 ± 0.13, whereas in the optical biometry group, mean pre-op BCVA was 0.23± 0.15. Postoperatively, the optical biometry group has significantly better visual outcomes than the immersion biometry group at each of the three follow-up points (day 1,8, and 30). On postop day 1, the mean BCVA was 0.29 ± 0.13 in immersion group and 0.17 ± 0.07 in optical biometry group (P<0.0001). On day 8, the mean BCVA in the immersion group was 0.16 ± 0.12 as compared to the optical biometry group where it was 0.06 ± 0.06 (P < 0.0001)
On day 30, in immersion biometry group, the mean BCVA was 0.07 ± 0.08 as compared to optical group which was 0.02 ± 0.04. (P<0.0001). Interestingly, Roy and colleagues(22) found no statistically significant difference in best corrected visual acuities between ultrasound biometry (0.014 ± 0.035) and partial coherence interferometry (0.022 ± 0.051) groups. ( P = 0.627).
Desired refractive outcome was -0.5 D in both immersion biometry group and optical biometry group, in contrast to the study by Fontes et al(18), where the mean programmed refractive outcome in immersion US biometry group was -0.76 ± 0.26, while in optical biometry group, it was -0.47 ± 0.43 (p value <0.0001). The mean final achieved refraction in immersion biometry group in our cohort was -0.53± 0.53 and in optical biometry group, it was -0.37 ± 0.26. This was similar to the mean final achieved refraction in the Fontes et al(18) study – in immersion biometry group, it was -0.5 ± 0.5D while in optical biometry group, it was-0.32 ± 0.54.
In immersion biometry group, 50 % (45 eyes) had refraction within 0.25D of desired refraction while in optical biometry group, 73.3% (66 eyes) had refraction within 0.25D of desired refraction. (P= <0.0001). In immersion biometry group, 78.9 % (71 eyes) had refraction within 0.5D of desired refraction while in optical biometry group, 100% (90 eyes) had refraction within 0.5D of desired refraction. (P= <0.0001). In immersion biometry group, 96.7 % (87 eyes) had refraction within 1D of desired refraction while in optical biometry group, 100% (90 eyes) had refraction within 1D of desired refraction. (P= 0.25). These findings are in agreement with the study conducted by Landers J et al(17) and Beatriz Machado Fontes et al(18), Aravind Roy et al(52), MS Rajan et al(13), Hiral Solanki et al(20) which shows optical biometry being more accurate than immersion biometry in predicting post-operative refractive outcome.
Landers J et al(17) found that 49% per cent of patients were within 0.5 D of target refraction and 85% were within 1.0 D when the immersion ultrasound was used, compared with 75 % and 93% within 0.5 and 1.0 D respectively when using IOL Master (optical biometry) (P = 0.04).
Beatriz Machado Fontes et al(18) found that in US group, 45.7% of the eyes achieved a postoperative refraction that differed by <0.25 D from the predicted value, as compared with 68% of the eyes in PCI group. 94.3% of the eyes in the US group were within 1.00 D of the planned refraction, and all the eyes in the PCI group met this criterion.
A study conducted by Aravind Roy et al(22), 100% and 71.42% of patients were within 1D of final predicted refraction in the PCI and US groups, respectively. MS Rajan et al(13) found 87% of patients were within ± 1 D of desired post-op refraction in the optical biometry group as compared to 80% in the ultrasound group (P = 0.24). Along similar lines, Hiral Solanki et al(20) found that 79% of the eyes in the ultrasound group achieved postoperative refraction within 1 D of the predicted value as compared to 88% of patients in the PCI group.
Whang W. et al(19), Haigis W. et al(23), Kiss B.et al(24) and Kim SM et al(25) also showed that optical biometry is more accurate in predicting postoperative refraction. Drexler W. et al(26) and Findl O et al (10) have shown improved predictive value of optical biometry upto 27%. Shorkovska et al(23) also concluded that optical biometry was more accurate but difference between predicted and actual refraction was not significant. Song BY et al(27) and Haigis et al(23) found similar precision between ultrasound and optical biometry.
Sang Woo Moon et al(6) compared postoperative refraction using applanation US and optical biometry and found no significant difference in predicting postoperative refraction by two methods. However, we found optical biometry to be more accurate than immersion US biometry in predicting postoperative refraction.
Optical biometry cannot measure accurate axial length in cases of dense cataracts, posterior capsular cataract, and difficult fixation.(28) So, we didn’t include eyes with mature cataract and posterior subcapsular cataract. Therefore, refractive outcome in eyes with mature and posterior subcapsular cataract couldn’t be studied due to loss of accuracy with optical biometry.
In conclusion, optical biometry improves the predictive value of postoperative refraction in eyes undergoing cataract surgery. It is less time-consuming and has the advantages of improved precision and patient acceptability when compared to conventional immersion ultrasound biometry. However, it cannot measure accurate axial length in patients with mature cataract, an issue of significant import in developing countries like India where many patient have dense cataract at the time of presentation. In such cases, immersion biometry becomes necessary.
References
- WHO Facts | International Agency for the Prevention of Blindness [Internet]. [cited 2017 Jun 11]. Available from: https://www.iapb.org/vision-2020/global-facts
- Liu B, Xu L, Wang YX, Jonas JB. Prevalence of cataract surgery and postoperative visual outcome in Greater Beijing: the Beijing Eye Study. Ophthalmology. 2009 Jul;116(7):1322–31.
- Yorston D, Gichuhi S, Wood M, Foster A. Does prospective monitoring improve cataract surgery outcomes in Africa? Br J Ophthalmol. 2002 May;86(5):543–7.
- Oliveira DF de, Lira RPC, Lupinacci APC, Paccola M, Arieta CEL. Cataract surgery complications as a cause of visual impairment in a population aged 50 and over. Cad Saude Publica. 2008 Oct;24(10):2440–4.
- Tabin G, Chen M, Espandar L. Cataract surgery for the developing world. Curr Opin Ophthalmol. 2008 Jan;19(1):55–9.
- Moon SW, Lim SH, Lee HY. Accuracy of Biometry for Intraocular Lens Implantation Using the New Partial Coherence Interferometer, AL-scan. Korean J Ophthalmol KJO. 2014 Dec;28(6):444–50.
- Olsen T. Sources of error in intraocular lens power calculation. J Cataract Refract Surg. 1992;18:125–9.
- Rehak, J., Falhar, M. The contact and immersion ultrasound method compared using the ray tracing method,. 2010;XL:77–92.
- Giers U, Epple C. Comparison of A-scan device accuracy. J Cataract Refract Surg. 1990;16:235–42.
- Findl O, Drexler W, Menapace R, Heinzl H, Hitzenberger CK, Fercher AF. Improved prediction of intraocular lens power using partial coherence interferometry. J Cataract Refract Surg. 2001;27:861–7.
- Nemeth J, Fekete O, Pesztenlehrer N. Optical and ultrasound measurement of axial length and anterior chamber depth for intraocular lens power calculation. J Cataract Refract Surg. 2003;29:85–8.
- Findl O, Drexler W, Menapace R, Hitzenberger CK, Fercher AF. High precision biometry of pseudophakic eyes using partial coherence interferometry. J Cataract Refract Surg. 1998 Aug;24(8):1087–93.
- Rajan MS, Keilhorn I, Bell JA. Partial coherence laser interferometry vs conventional ultrasound biometry in intraocular lens power calculations. Eye(Lond). 2002;16:552–6.
- Cruysberg LPJ, Doors M, Verbakel F, Berendschot TTJM, De Brabander J, Nuijts RMMA. Evaluation of the Lenstar LS 900 non-contact biometer. Br J Ophthalmol. 2010 Jan;94(1):106–10.
- Buckhurst PJ, Wolffsohn JS, Shah S, Naroo SA, Davies LN, Berrow EJ. A new optical low coherence reflectometry device for ocular biometry in cataract patients. Br J Ophthalmol. 2009 Jul;93(7):949–53.
- Skorkovská S, Michálek J, Ruberová M, Synek S. [Comparison of ultrasound and optic biometry with respect to ocular refraction after cataract surgery]. Ceska Slov Oftalmol Cas Ceske Oftalmol Spolecnosti Slov Oftalmol Spolecnosti. 2004 Jan;60(1):24–9.
- Landers J, Goggin M. Comparison of refractive outcomes using immersion ultrasound biometry and IOLMaster biometry. Clin Experiment Ophthalmol. 2009 Aug;37(6):566–9.
- Fontes BM, Fontes BM, Castro E. Intraocular lens power calculation by measuring axial length with partial optical coherence and ultrasonic biometry. Arq Bras Oftalmol. 2011 Jun;74(3):166–70.
- Whang W-J, Jung B-J, Oh T-H, Byun Y-S, Joo C-K. Comparison of postoperative refractive outcomes: IOLMaster® versus immersion ultrasound. Ophthalmic Surg Lasers Imaging Off J Int Soc Imaging Eye. 2012 Dec;43(6):496–9.
- Dr. Hiral Solanki, Dr. Dhara Patel, Dr. Aishwarya Chhabra. International Journal of Science and Research (IJSR). 2015;4(9):1905-08.
- Aktas S, Aktas H, Tetikoglu M, Sagdk HM, Özcura F. Refractive Results Using a New Optical Biometry Device: Comparison With Ultrasound Biometry Data. Medicine (Baltimore). 2015 Dec;94(48):e2169.
- Roy A, Das S, Sahu SK, Rath S. Ultrasound biometry vs. IOL Master. Ophthalmology. 2012 Sep;119(9):1937.e1-2.
- Haigis W, Lege B, Miller N, Schneider B. Comparison of immersion ultrasound biometry and partial coherence interferometry for intraocular lens calculation according to Haigis. Graefes Arch Clin Exp Ophthalmol Albrecht Von Graefes Arch Klin Exp Ophthalmol. 2000 Sep;238(9):765–73.
- Kiss B, Findl O, Menapace R, Wirtitsch M, Petternel V, Drexler W, et al. Refractive outcome of cataract surgery using partial coherence interferometry and ultrasound biometry: clinical feasibility study of a commercial prototype II. J Cataract Refract Surg. 2002 Feb;28(2):230–4.
- Kim SM, Choi J, Choi S. Refractive predictability of partial coherence interferometry and factors that can affect it. Korean J Ophthalmol KJO. 2009 Mar;23(1):6–12.
- Drexler W, Findl O, Menapace R, Rainer G, Vass C, Hitzenberger CK, et al. Partial coherence interferometry: a novel approach to biometry in cataract surgery. Am J Ophthalmol. 1998 Oct;126(4):524–34.
- Song BY, Yang KJ, Yoon KC. Accuracy of partial coherence interferometry in intraocular lens power calculation.2005;46:. 19. J Korean Ophthalmol Soc. 2005;46:775–80.
- Tehrani M, Krummenauer F, Blom E, Dick HB. Evaluation of the practicality of optical biometry and applanation ultrasound in 253 eyes. 2003;29:741-6. J Cataract Refract Surg. 2003;29:741–6.
Leave a Comment