

Dr. Birendra Prasad Kashyap, Dr. BIBHUTI B. KASHYAP, Dr. Nidhi Gadkar
Purpose:
To evaluate the Implantation Behaviour of Ozonated and Non Ozonated Preloaded Intra Ocular Lens Systems, its long-term effect on Glistening and Visual Function in the initial 100 cases
Methods:
All patients were divided into: – Ozonated IOL System (Gr-1) & Non Ozonated IOL System (Gr-2). The main Outcomes were grades of Glistening, Post-Op BCVA, Contrast Sensitivity (CS) expressed as Modular Function in Photopic and Mesopic Conditions at 7, 90 days & 2 years
Results:
At 2 years, difference of occurrence of glistening is significant p=0.00001, VA decreased non-significantly in Gr-2 as compared to Gr-1 at 2 years (p=0.051). CS decreased significantly at 2 years in Gr-2 in Photopic @ 10cpd = (p=.000), @ 15cpd = (p=0.025) & Mesopic @ 10cpd (p=0.004), @ 15cpd (p=0.003)
Conclusions:
Glistening increased in both severity and incidence in Ultrasert Gr by 2 yrs, causing significant decrease in CS at higher spatial frequencies
Main Paper
INTRODUCTION
Phacoemulsification with IOL implantation may lead to an increase in original incision size occurring at various steps. Maximum incision stretch has been shown to occur during IOL implantation. Many studies have reported that an irreversible increase in incision size follows phacoemulsification surgery due to initial stretch-related incision tearing.
Various factors have been seen to affect the amount of incision enlargement, including dioptric power of IOL, type of IOL, type of keratome, and speed of IOL insertion.
Few studies have reported that IOL power, material, and shape of cartridge do not affect incision size. According to them, width of injector is the only factor which affects incision enlargement significantly. However, most of these studies have been done on incisions of size 2.5mm.
In our study, we compared incision enlargement with 2.2mm incision and found the incision to enlarge in 100% of the cases, when using D cartridge with manual injector.
Considerable controversies exist regarding the extent of impact on visual function due to glistening. Most of the earlier studies have reported that these changes did not influence the visual function. However, contradictory data exists for Contrast Sensitivity at higher spatial frequencies.
Method:-
This was a prospective study and patients were randomly divided into two groups i.e. Ozonated type Preloaded IOL systems and Non Ozonated Type Preloaded IOL systems.
All surgeries were performed by a single experienced surgeon for approximately the same operating time. Any complications arising during insertion of IOL were recorded and analyzed. Any variance was removed from the list.
A total of 100 patients, 50 patients in each group were taken for the study.
Inclusion Criteria:-
- Age between 50 to 75 years
- Cataract Included Nuclear cataract grade NO1-NC1 TO NO2.9-NC2.9 as per nuclear colour and opalescence based on lens opacities classification system III,
- Corneal endothelial cell count greater than 2000 cells/mm2,
- Power of IOL implanted were from 20.00 D to 23.50 D. (rest were excluded)
Exclusion Criteria:-
- Poor dilating pupil<5 mm,
- Previous ocular trauma or intraocular surgery,
- Keratoconus,
- Chronic uveitis,
- Zonular dialysis,
- Pseudoexfoliation syndrome,
- Glaucoma,
- Any corneal pathology that can impede corneal evaluation by specular microscopy
- Patients in whom the incision size enlarged by more than 2.4 mm after irrigation–aspiration and before IOL was implanted were excluded from the study.
Implantation behavior of the IOL Delivery were noted and documented. No IOL damage was reported during implantation procedure.
Parameters Assessed
Pre-operative Parameters:-
IOL implantation behavior & Wound stretch
Post-operative Parameters:-
The main Outcomes were recorded at 7 days, 90 days & 2 years respectively. These includes:-
Grades of Glistening,
Posterior Capsular Thickening,
Post-Operative BCVA,
Contrast Sensitivity (CS) expressed as Modular Function in Photopic and Mesopic Conditions.
Results:-
DEMOGRAPHIC CHARACTERISTICS OF STUDY GROUPS (AGE)
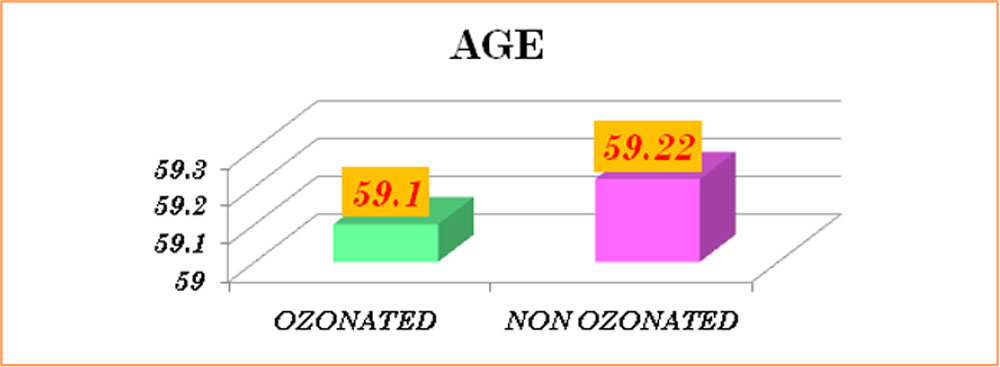 Figure showing the distribution of Age between the Ozonated Type and Non Ozonated Type IOL Injector System
Table showing the Distribution of Age
| PARAMETERS | OZONATED TYPE IOL | NON OZONATED TYPE IOL |
| AGE | 59.1 ± 3.35 | 59.22 ± 2.83 |
The above chart shows difference of the distribution of Age is no significant between the groups (p = 0.962)
Gender Distribution
| PARAMETERS | OZONATED TYPE IOL | NON OZONATED TYPE IOL |
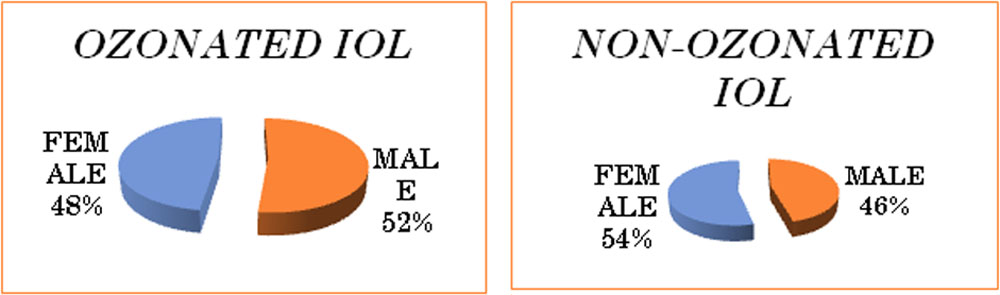
| GENDER | M= 26(52%), F=24(48%) | M= 23(46%), F= 27(54%) |
The above chart shows difference of the distribution of Gender is non significant between the groups (p =0.55 & p=0.548 for males & females respectively)
Implantation Behavior and changes in IOL positioning
Haptic related problem
| Distribution of Haptic related problem | ||||
| GROUP | Total | |||
| OZONATED TYPE | NON OZONATED TYPE | |||
| HAPTIC RELATED PROBLEM | YES | 0 | 20 | 20 |
| NO | 50 | 30 | 80 | |
| Total | 50 | 50 | 100 | |
In Ozonated Type IOL group no case (0/50) has developed haptic problem while in Non Ozonated Type (20/50) 40% developed haptic problem. Using Chi Square test, the difference is statistically significant with p=0.0001
| Difference | 40 % |
| 95% CI | 25.70 to 53.82 |
| Chi-squared | 24.750 |
| DF | 1 |
| Significance level | P = 0.0001 |
Haptic Extension problem
| Distribution of extended problem | ||||
| GROUP | Total | |||
| OZONATED TYPE | NON OZONATED TYPE | |||
| Ext.prob. | YES | 0 | 14 | 14 |
| NO | 50 | 36 | 86 | |
| Total | 50 | 50 | 100 | |
In Ozonated Type IOL group no case (0/50) has developed haptic problem while in Non Ozonated Type (14/50) 28 % developed Extended haptic Issue. Using Chi Square test, the difference is statistically significant with p=0.0001
| Difference | 28 % |
| 95% CI | 15.28 to 41.66 |
| Chi-squared | 16.116 |
| DF | 1 |
| Significance level | P = 0.0001 |
Wound stretch at the Incision Site
For Ozonated Type IOL group
| Paired Samples Statistics | |||||
| Mean | N | Std. Deviation | Std. Error Mean | ||
| Pair 1 | pre operative incision width | 1.800 | 50 | .0000 | .0000 |
| post operative width | 2.380 | 50 | .1278 | .0181 | |
| Paired Samples Test | |||||||||
| Paired Differences | t | df | Sig. (2-tailed) | ||||||
| Mean of difference | Std. Deviation | Std. Error Mean | 95% Confidence Interval of the Difference | ||||||
| Lower | Upper | ||||||||
| Pair 1 | pre Op. Incision width – post Op width | -.5800 | .1278 | .0181 | -.6163 | -.5437 | -32.09 | 49 | .000 |
When the pre operative width is compared with post operative, the difference is coming out to be significant with p=0.000
For Non Ozonated Type IOL System
| Paired Samples Statistics | |||||
| Mean | N | Std. Deviation | Std. Error Mean | ||
| Pair 1 | pre operative incision width | 2.200 | 50 | .0000 | .0000 |
| post operative width | 2.208 | 50 | .0670 | .0039 | |
| Paired Samples Test | |||||||||
| Paired Differences | t | df | Sig. (2-tailed)
P value |
||||||
| Mean of difference | Std. Deviation | Std. Error Mean | 95% Confidence Interval of the Difference | ||||||
| Lower | Upper | ||||||||
| Pair 1 | Pre Op Incision width – post Op width | -.0080 | .0274 | .0095 | -.1331 | -.0949 | -12.02 | 49 | .000 |
The difference between pre operative and post operative if significant with p=0.000
Comparison between Ozonated Type and Non Ozonated Type IOL Systems
Table for the Group statics for Difference between the Ozonated type and Non Ozonated type Preloaded System.
| Group Statistics | |||||
| group | N | Mean | Std. Deviation | Std. Error Mean | |
| Difference | 1 | 50 | .580 | .1278 | .0181 |
| 2 | 50 | .106 | .0740 | .0105 | |
Table for the t-test for Equality of Means for Difference between the Ozonated type and Non Ozonated type Preloaded System.
| t-test for Equality of Means | ||||||||
| t | df | Sig. (2-tailed)
P value |
Mean Difference | Std. Error Difference | 95% Confidence Interval of the Difference | |||
| Lower | Upper | |||||||
| difference | Equal variances assumed | 22.700 | 98 | .000 | .4740 | .0209 | .4326 | .5154 |
Chart Showing the Distribution of Wound Stretch for Screw Type and Piston Type
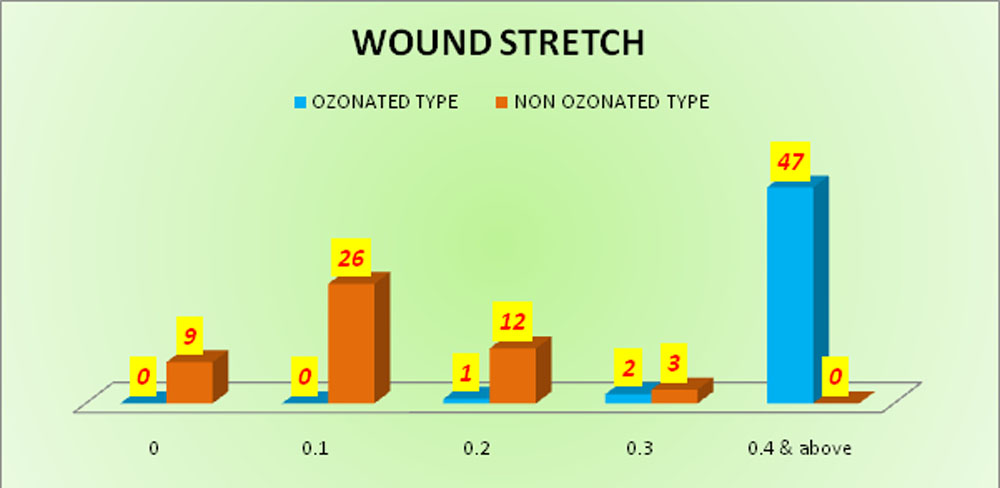
The per operative Change in width is significantly more in Screw type Foldable Group as compared to Piston Type Foldable IOL Group
STATISTICAL ANALYSIS FOR GLISTENING AT 7 DAYS
Chart Showing the Statistical Analysis for glistening at 7 days post operative
| Distribution of Glistening Ozonated and Non Ozonated IOL | ||||
| Glistening at 7 days | GROUP | Total | ||
| OZONATED IOL | NON-OZONATED IOL | |||
| No glisteing | 50a | 49a | 99 | |
| Mild | 0a | 1a | 1 | |
| Total | 50 | 50 | 100 | |
| Each subscript letter denotes a subset of GROUP categories whose column proportions do not differ significantly from each other at the .05 level. | ||||
There was only no case at day 7 in OZONATED IOL group and 1 case with mild glistening was found in NON-OZONATED IOL group.
Chart Showing the Statistical Analysis for glistening at 90 days post operative
| Distribution of Glistening Ozonated and Non Ozonated IOL | ||||
| Glistening at 90 days | GROUP | Total | ||
| OZONATED IOL | NON-OZONATED IOL | |||
| No glisteing | 49a | 47a | 96 | |
| Mild | 1a | 3a | 4 | |
| Total | 50 | 50 | 100 | |
| Each subscript letter denotes a subset of GROUP categories whose column proportions do not differ significantly from each other at the .05 level. | ||||
Similarly, glistening occurred in one case in OZONATED IOL surgery after 90 days while it occurred in 3 cases in NON-OZONATED IOL surgery. However, these difference were not statistically significant ( p>0.05)
Chart Showing the Statistical Analysis for glistening at 2 years post operative
| Distribution of Glistening Ozonated and Non Ozonated IOL | ||||
| Glistening at 2 Yrs. | GROUP | Total | ||
| OZONATED | NON OZONATED | |||
| No Glistening | 40 | 15 | 55 | |
| Mild Glistening | 8 | 26 | 34 | |
| Moderate Glistening | 2 | 7 | 9 | |
| Severe Glistening | 0 | 2 | 2 | |
| Total | 50 | 50 | 100 | |
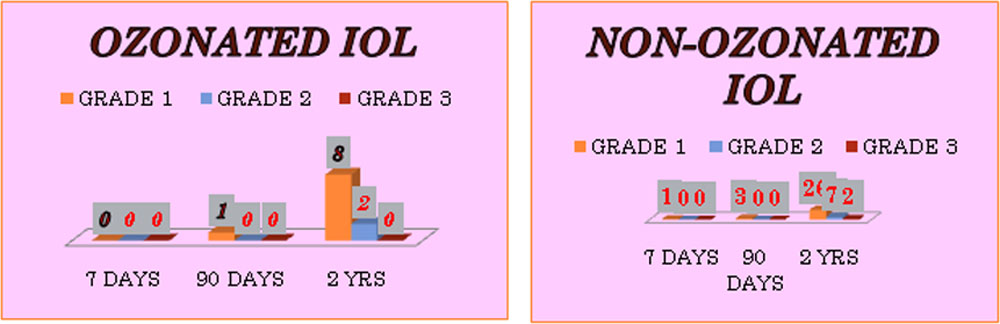
The above table shows that out of 50 patients, the glistening occurred in 10 patients ( 20%) while in NON-OZONATED IOL group it occurred in 35 ( 70%) patients out of total 50 patients. The difference of occurrence of glistening is statistically significant p= 0.00001, 95%CI (31.05% to 64.01%) using the proportion test for comparison of two proportions of two groups viz. OZONATED IOL vs. NON-OZONATED IOL groups
Graph Showing the distribution of Glistening at 7 days, 90 days and 2 years respectively for Ozonated and Non Ozonated IOLs
 Statistical Analysis for Visual Acuity at 7 days, 90 days and 2 years
Chart Showing the Statistical Analysis for glistening at 7 days, 90 days & 2 years post Op
| Descriptive for Visual Actuity | |||||
| GROUP | N | Mean | Std. Deviation | Std. Error Mean | |
| BCVA 7 DAYS | OZONATED IOL | 50 | .9920 | .03959 | .00560 |
| NON-OZONATED IOL | 50 | .9774 | .07047 | .00997 | |
| BCVA 90 DAYS | OZONATED IOL | 50 | .9814 | .06571 | .00929 |
| NON-OZONATED IOL | 50 | .9708 | .08271 | .01170 | |
| BCVA 2 DAYS | OZONATED IOL | 50 | .9734 | .07471 | .01057 |
| NON-OZONATED IOL | 50 | .9350 | .11546 | .01633 | |
Chart Showing the T-Test for Equality of Means for glistening at 7 days, 90 days and 2 years
| T-TEST FOR EQUALITY OF MEANS | |||||||
| t | df | Sig. (2-tailed) | Mean Difference | Std. Error Difference | 95% Confidence Interval of the Difference | ||
| Lower | Upper | ||||||
| BCVA 7 DAYS | 1.277 | 98 | .205 | .01460 | .01143 | -.00809 | .03729 |
| BCVA 90 DAYS | .710 | 98 | .480 | .01060 | .01494 | -.01905 | .04025 |
| BCVA 2 YEARS | 1.974 | 98 | .051 | .03840 | .01945 | -.00020 | .07700 |
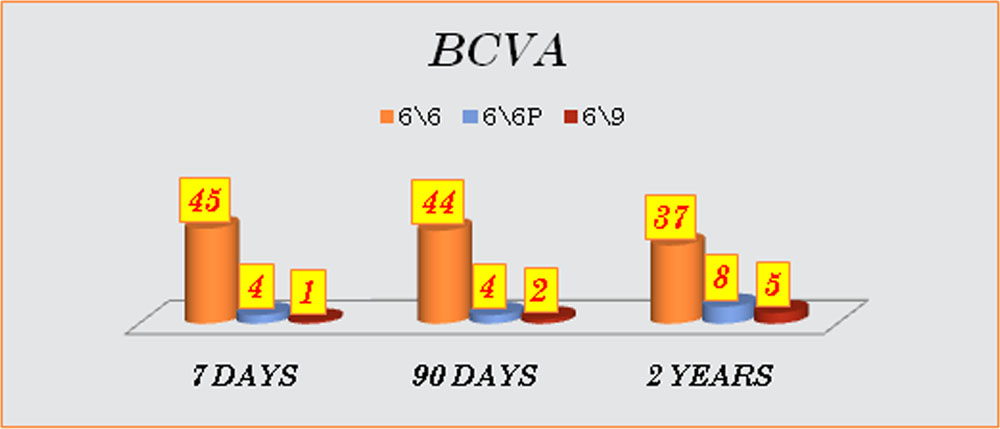
Table shows the mean and SD of the VA data for Ozonated and Non-Ozonated groups. It indicates the VA decrease higher in Non-Ozonated group (mean=0.93) as compared to Ozonated group (mean=0.97) at 2years. Higher value of mean shows better VA
Chart shows the Distribution of Visual Acuity for Ozonated IOL groups at 7 days, 90 days & 2 years.
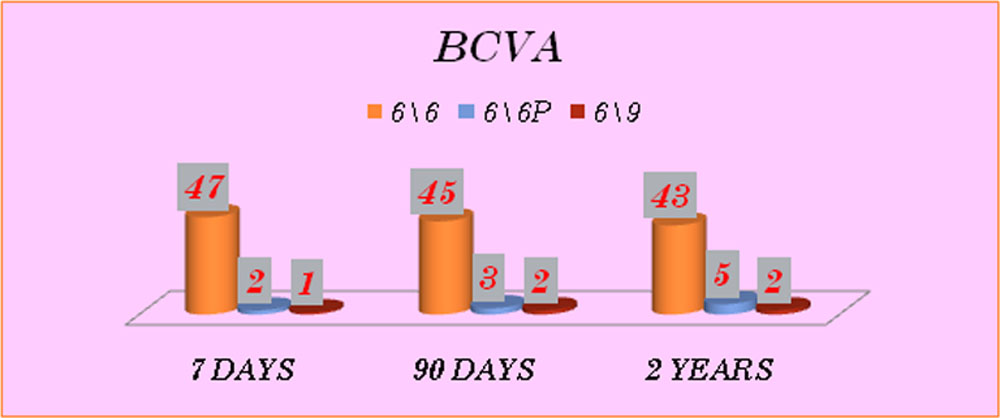 Chart shows the Distribution of Visual Acuity for Non-Ozonated IOL groups at 7 days, 90 days & 2 years.
 Descriptive Analysis for change of Visual Acuity from 7 days to 90 days and from 7 days to 2 years
| Descriptive for Visual Acuity | |||||
| Change in Visual Acuity |
GROUP | N | Mean | Std. Deviation | Std. Error Mean |
| 7- 90 Days | OZONATED IOL | 50 | .0106 | .04316 | .00610 |
| NON-OZONATED IOL | 50 | .0066 | .03342 | .00473 | |
| 7 days- 2yrs | OZONATED IOL | 50 | .0186 | .05707 | .00807 |
| NON-OZONATED IOL | 50 | .0424 | .07795 | .01102 | |
| Change in VA | t-test for Equality of Means | ||||||
| t | df | Sig. (2-tailed) | Mean Difference | Std. Error Difference | 95% Confidence Interval of the Difference | ||
| Lower | Upper | ||||||
| 7 to 90 Days | .518 | 98 | .606 | .00400 | .00772 | -.01132 | .01932 |
| 7 to 2 Years | -1.742 | 98 | .085 | -.02380 | .01366 | -.05091 | .00331 |
The mean difference in change of VA from 7 days to 2 Years is statistically non significant with mean difference -0.24, p=0.085. It indicates that the decrease is less in Ozonated group as compared to Nonozonated group at 2 yrs after surgery.
STATISTICAL ANALYSIS FOR POSTERIOR CAPSULE OPACIFICATION
| Difference | 2 % |
| 95% CI | -8.2472 to 12.6196 |
| Chi-squared | 0.208 |
| DF | 1 |
| Significance level | P = 0.6480 |
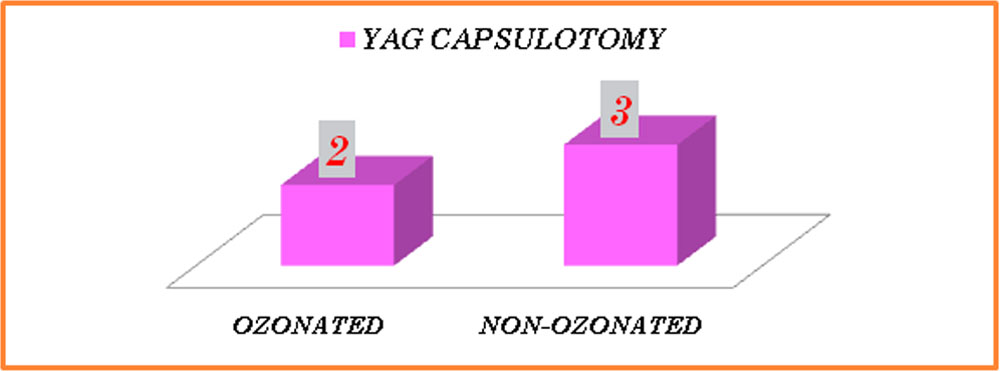
Yag capsulotomy was done in 4 % ( 2/50) in Ozonated group while it was done in 6 % (3/50) in Non Ozonated group. The difference is not significant p=0.6480 or 0.65 (p>0.05)
Contrast Sensitivity at Photopic and Mesopic Conditions
DESCRIPTIVE – ONE WAY ANALYSIS (GROUP STATISTICS) FOR MFT VALUES AT 10 CPD IN PHOTOPIC CONDITIONS
| GROUP | N | Mean | Std. Deviation | Std. Error Mean | |
| 7 DAYS | OZONATED | 50 | .349400 | .0334670 | .0047330 |
| NON OZONATED | 50 | .352000 | .0315582 | .0044630 | |
| 90 DAYS | OZONATED | 50 | .335400 | .0425805 | .0060218 |
| NON OZONATED | 50 | .353600 | .0371297 | .0052509 | |
| 2 YEARS | OZONATED | 50 | .316800 | .0498749 | .0070534 |
| NON OZONATED | 50 | .351200 | .0359501 | .0050841 |
| t-test for Equality of Means | |||||||
| t | df | Sig. (2-tailed) | Mean Difference | Std. Error Difference | 95% Confidence Interval of the Difference | ||
| Lower | Upper | ||||||
| 7 DAYS | -0.4 | 98 | 0.69 | -0.0026 | 0.006505 | -0.01551 | 0.01031 |
| 90 DAYS | -0.278 | 98 | 0.35 | -0.0182 | 0.00799 | -0.03406 | -0.00234 |
| 2 YRS | -3.956 | 98 | 0.000 | -0.0344 | 0.008695 | -0.05165 | -0.01715 |
The above table shows Group statistics and T test for values @ 10 cpd at 7 days, 90 days and 2 Years post Op in Photopic Conditions. Results shows that there is statistical significance between Ozonated and Non Ozonated Iol Systems at 2 years
DESCRIPTIVE – ONE WAY ANALYSIS (GROUP STATISTICS) FOR MFT VALUES AT 15 CPD IN PHOTOPIC CONDITIONS
| GROUP | N | Mean | Std. Deviation | Std. Error Mean | |
| 7 DAYS | OZONATED | 50 | .223800 | .0344573 | .0048730 |
| NON OZONATED | 50 | .230800 | .0287736 | .0040692 | |
| 90 DAYS | OZONATED | 50 | .2008 | .02648 | .00375 |
| NON OZONATED | 50 | .2026 | .02257 | .00319 | |
| 2 YEARS | OZONATED | 50 | .166400 | .0337917 | .0047789 |
| NON OZONATED | 50 | .163800 | .0318087 | .0044984 |
| t-test for Equality of Means | |||||||
| t | df | Sig. (2-tailed) | Mean Difference | Std. Error Difference | 95% Confidence Interval of the Difference | ||
| Lower | Upper | ||||||
| 7 DAYS | -1.103 | 98 | 0.273 | -0.007 | 0.006349 | -0.0196 | 0.005599 |
| 90 DAYS | -0.366 | 98 | 0.715 | -0.0018 | 0.00492 | -0.01157 | 0.00797 |
| 2 YRS | 2.996 | 98 | 0.004 | 0.0026 | 0.006563 | -0.01042 | 0.015624 |
The above table shows Group statistics and T test for values @ 15 cpd at 7 days, 90 days and 2 Years post Op in Photopic Conditions. Results shows that there is statistical significance between Ozonated and Non Ozonated Iol Systems at 2 years
DESCRIPTIVE – ONE WAY AALYSIS (GROUP STATISTICS) FOR MFT VALUES AT 10 CPD IN MESOPIC CONDITIONS
| GROUP | N | Mean | Std. Deviation | Std. Error Mean | |
| 7 DAYS | OZONATED | 50 | .290000 | .0206032 | .0029137 |
| NON OZONATED | 50 | .285600 | .0229605 | .0032471 | |
| 90 DAYS | OZONATED | 50 | .295600 | .0639885 | .0090493 |
| NON OZONATED | 50 | .329600 | .0425686 | .0060201 | |
| 2 YEARS | OZONATED | 50 | .257800 | .0470471 | .0066535 |
| NON OZONATED | 50 | .223600 | .0666627 | .0094275 |
| t-test for Equality of Means | |||||||
| t | df | Sig. (2-tailed) | Mean Difference | Std. Error Difference | 95% Confidence Interval of the Difference | ||
| Lower | Upper | ||||||
| 7 DAYS | 1.009 | 98 | 0.316 | 0.0044 | 0.004363 | -0.00426 | 0.013058 |
| 90 DAYS | -1.128 | 98 | 0.302 | -0.034 | 0.010869 | -0.05557 | -0.01243 |
| 2 YRS | 2.964 | 98 | 0.004 | 0.0342 | 0.011539 | 0.011301 | 0.057099 |
The above table shows Group statistics and T test for values @ 10 cpd at 7 days, 90 days and 2 Years post Op in Mesopic Conditions. Results shows that there is statistical significance between Ozonated and Non Ozonated Iol Systems at 2 years
DESCRIPTIVE – ONE WAY ANALYSIS (GROUP STATISTICS) FOR MFT VALUES AT 15 CPD IN MESOPIC CONDITIONS
| GROUP | N | Mean | Std. Deviation | Std. Error Mean | |
| 7 DAYS | OZONATED | 50 | .290000 | .0206032 | .0029137 |
| NON OZONATED | 50 | .285600 | .0229605 | .0032471 | |
| 90 DAYS | OZONATED | 50 | .295600 | .0639885 | .0090493 |
| NON OZONATED | 50 | .329600 | .0425686 | .0060201 | |
| 2 YEARS | OZONATED | 50 | .257800 | .0470471 | .0066535 |
| NON OZONATED | 50 | .223600 | .0666627 | .0094275 |
| t-test for Equality of Means | |||||||
| t | df | Sig. (2-tailed) | Mean Difference | Std. Error Difference | 95% Confidence Interval of the Difference | ||
| Lower | Upper | ||||||
| 7 DAYS | -1.587 | 98 | 0.191 | -0.0168 | 0.006494 | -0.02969 | -0.00391 |
| 90 DAYS | -0.03 | 98 | 0.976 | -0.0002 | 0.006716 | -0.01353 | 0.013127 |
| 2 YEARS | 3.084 | 98 | 0.003 | 0.0242 | 0.007846 | 0.008629 | 0.039771 |
The above table shows Group statistics and T test for values @ 15 cpd at 7 days, 90 days and 2 Years post Op in Mesopic Conditions. Results shows that there is statistical significance between Ozonated and Non Ozonated Iol Systems at 2 years
Discussion:-
Preloaded IOL systems differ depending on their design and ozonation.
Preloaded IOL delivery systems are expected to provide effective and safe IOL delivery by reducing IOL loading errors, additional handling of IOLs, and surgical time.
Preloaded delivery systems can also reduce IOL injector loading errors, which may cause undesirable IOL behavior such as haptic entrapment or injector plunger overriding. There was no case with those undesirable IOL behaviors in this study. Previous studies have indicated that preloaded IOL delivery systems were less effective and were associated with a greater chance of contamination. However, predictability of IOL delivery is not solely determined by injector systems, because other factors such as surgeon’s skills, type and material of IOL also affect predictability of IOL delivery
In our study we found that Non Ozonated Piston Type IOL System has more control during delivery resulting in significantly lesser wound stretch and maintains wound integrity with the incision guard. The incidence of haptic extension was found to be significantly more in Non Ozonated Piston Type Systems.
2 years follow up showed non-significant decrease in Visual Acuity in the Non Ozonated type IOL systems as compared to the Ozonated IOL systems, However there was no change at 7 days and 90 days Post Operative Follow up
In our study 2 years follow up showed that Contrast Sensitivity significantly decreased in Non Ozonated Preloaded Piston Type Systems resulting in decrease in the quality of vision and patient’s satisfaction.
Glistening was reported to get worse in due course of time for the Non Ozonated Type IOL Systems. At 2 years follow up Glistening was found to be significantly in Non Ozonated Type IOLs.
At 2 years, the need for Yag Capsulotomy was lesser in both the groups which were statistically non-significant.
Conclusion:-
Post Implantation Incision Width is significantly more than incision width at the start of surgery in both the Screw type and Piston Type Group. The Change in width is significantly more in Screw type Foldable Group as compared to Piston Type Foldable IOL Group
Minimizing the incidence of PCO and improving quality of vision can only be envisaged with high quality surgery and capsular bag implantation. The choice of the IOL, in terms of material, design and improved biocompatibility, treated posterior IOL surface for protein adhesion, is an overriding element in this quest
Take Home Message:-
Ozone Treated IOLs have Strong capsular adhesion hence reducing the risk of PCO formation over a longer duration of time resulting in better visual quality.
Leave a Comment