

Dr.Mrunmayi Jeste,Dr.Saravanan V R
ABSTRACT:
Aim:
To measure foveal avascular zone by OCT-Angiography and to establish a correlation between foveal avascular zone enlargement and changes in visual acuity, contrast sensitivity, central visual fields, mfERG and systemic factors in non-proliferative diabetic retinopathy.
Methods:
This is a cross sectional observational study, which was, conducted at our hospital between July 2017 and June 2018. 57 eyes of 57 patients with NPDR were included in the study. The foveal avascular zone of these patients was studied by OCT- Angiography. Parameters like greatest linear dimension(GLD), greatest horizontal diameter(GHD), greatest vertical diameter(GVD) and area of FAZ were noted by two independent observers. The patients also underwent multifocal ERG and 10-2 perimetry. A battery of routine blood investigations including HbA1c, lipid profile, renal profile were done and the data for each participant was noted in study proforma.
Results:
Inter-observer variations in the values of FAZ parameters were found to be insignificant. Mean values of the average FAZ parameters were- FAZ area 380.8 micrometer, GLD 826.55 micrometer, MHD 773.6 micrometer and MVD 554.39 micrometer.
A significant positive correlation was found between the FAZ parameters GLD and MHD with increasing severity of NPDR.
No significant correlation was seen between FAZ parameters and other visual factors such as BCVA, contrast sensitivity, mfERG and 10-2 fields.
Amongst systemic factors, GLD was seen to have a significant correlation with hyperlipidemia. FAZ area and GLD were both found to have a significant association with nephropathy.
No significant correlation was observed between FAZ parameters and other systemic factors such as hypertension, glycemic control (HbA1c) and BMI.
Conclusions:
Inter-observer variations in calculation of values of FAZ parameters are insignificant thereby showing the values of the various parameters calculated on OCT- A in the study are reproducible.
Macular ischemia might be a marker for severity of retinopathy as well as nephropathy.
The presence of diabetic macular ischemia should prompt the need for further systemic evaluation. This may aid in the effective screening of maculopathy and nephropathy, thus reducing the ocular and systemic morbidity associated with diabetes.
Key words:
Diabetic macular ischemia, foveal avascular zone, optical coherence tomography- angiography.
INTRODUCTION:
India, with more than 65 million diabetic individuals, now has one of the largest diabetic populations in the world (1,2). Diabetes mellitus (DM) comprises a heterogeneous group of disorders of carbohydrate, protein and fat metabolism manifesting in hyperglycemia. Diabetic retinopathy is a spectrum of changes occurring due to microangiopathy resulting from the chronic effects of the disease (3). It shares similarities with the microvascular alterations that occur in other tissues vulnerable to DM, such as the kidneys and the peripheral nerves. Diabetic retinopathy is fast becoming one of the leading causes of blindness in India.
Vision loss in Diabetic retinopathy is most often caused by diabetic macular edema (DME), Diabetic Macular Ischemia (DMI) and due to complications of proliferative diabetic retinopathy. There is increased incidence of Diabetic macular edema (DME) seen in type 2 diabetes mellitus (DM) than in type 1 DM (4). Visual acuity of such patients is often dependent on the central foveal involvement, perifoveal capillary blood flow velocity, severity of perifoveal capillary occlusion, and retinal thickness at the central fovea (5,6).
Diabetic macular ischemia (DMI) is another important feature of diabetic retinopathy (DR). It is defined by an enlargement of the foveal avascular zone (FAZ) including the widening of paramacular areas of capillary nonperfusion(7). It has been observed that approximately 41% of patients with DR in a tertiary hospital setting have some evidence of diabetic macular ischemia(7).Recently, the RIDE and RISE trials analyses have shown that patients with DMI at baseline have progressed aggressively into proliferative changes seen in DR than those with normal perfusion at baseline seen during treatment with intravitreal ranibizumab(8). Hence it has become very important to have a baseline assessment of DMI status. This clinically helps the physician for planning the review schedule for patients receiving intravitreal injections. The areas of the FAZ have been validated as “correlated markers” in determining the progression of Diabetic retinopathy (9-17).
Fluorescein angiography is considered the gold standard for defining the foveal avascular zone; but it is invasive, time consuming and can lead to allergic reactions. Also, due to light scatter, fluorescein angiography is not able to define FAZ changes in the deep retinal layers. The recent development of OCT angiography (OCT-A) allows for the visualization of the retinal capillary layers and for the construction of microvascular flow maps (18-24). It is non-invasive, efficient and has been shown by studies to be as effective as fluorescein angiography.
The idea of our study is to correlate the anatomy of the macular perfusion with its functional ability- via best-corrected visual acuity, contrast sensitivity, multifocal electroretinogram and 10-2 visual field. Letter contrast sensitivity has been shown to be an effective screening tool to assess the damage to visual pathways in early diabetes (25). The mfERG provides information about the central retinal function by testing the central fovea and the four quadrants of macula inside the arcades. Whereas the 10-2 program in the Humphrey field Analyzer, measures 10 degrees temporally and nasally and tests 68 points. It is used for macular pathologies. Visual fields and mfERG have been reported to enable identification of early changes in diabetic retinopathy (26). So far, the progression of diabetic retinopathy has been marked by morphological changes. Our study wants to see the usefulness of visual function tests in assessing the course of diabetic retinopathy.
A number of risk factors- including duration and control of diabetes, hypertension, and hyperlipidemia – have been identified to have a major influence on the progression of diabetic retinopathy. Early detection of diabetic retinopathy and targeting these modifiable risk factors via aggressive treatment will ultimately decrease the loss of vision due to diabetic retinopathy.
MATERIAL & METHODS:
STUDY SITE– The study was conducted at our eye hospital ‘x’.
STUDY POPULATION– The study included urban, semi urban and rural population. Data was collected from outpatients with NPDR attending retina clinic. Patients of both sexes were included in the study subject to inclusion and exclusion criteria.
STUDY DESIGN – A Cross sectional observational study.
STUDY PERIOD- The study was conducted from July 2017 to June 2018.
SAMPLE SIZE– The objective of this thesis is to evaluate the macular perfusion defects in patients with non-proliferative diabetic retinopathy (NPDR) and their correlation with visual function and systemic factors. It is a cross-sectional observation study. The patients are classified as mild, moderate and severe NPDR. Therefore, the sample size is calculated using the following formula.
Where
pi = ni/ N, ni = number of observations in group i, N = Total number of observations,
mi = mean of group i, m = grand mean,
s2 = error variance within groups.
The study by HEMLATHA BC et al (62) is the reference used for calculations. The following parameters are given to the formula:
Number of groups = 3, power = 80%, alpha = 5%,
pi = (0.30, .45, .65), mi = (40, 51, 80), s = 0.46.
After substitution of these values, the predicted overall sample size for three groups was 56.69, thus each arm required 18.90 (19) samples to attain the desired power.
- INCLUSION AND EXCLUSION CRITERIA:
Inclusion Criteria–
- Established non-proliferative diabetic retinopathy patients as seen on fundus examination (ETDRS classification).
- Patients aged >18 years- must be able to provide informed consent.
- Patients who are ready to undergo investigation by Optical Coherence Tomography Angiography (OCT-A), 10-2 perimetry, mfERG and blood tests.
- Patients with Best Corrected Visual Acuity equal to or better than 6/24
Exclusion Criteria–
- Patients who have completed 6 months post-cataract surgery.
- Patients who have undergone previous retinal intervention or surgery.
- Patients with another coexisting retinal pathology.
- Patients with glaucoma, optic nerve disorders, significant cataract or refractive errors causing visual loss.
- Patients with poor quality images on OCT angiography (signal strength index [SSI] lower than 50) owing to eye movements, poor fixation or media opacities.
7.METHODOLOGY-
At the presentation of the patient, a detailed medical and ocular history was taken, including the duration of visual loss and thepresence of any ocular pathology or prior interventions. All patients underwent the following ophthalmic examination :
- Uncorrected and Best-corrected visual acuity were measured on ETDRS chart.
- Contrast sensitivity was measured with Mars Contrast Sensitivity Test. The chart has 48 numericals arranged in 8 rows.Each letter read correctly scores 0.04 log units
- Anterior segment evaluation by Slit lamp Examination.
- Posterior segment evaluation with slit lamp biomicroscopy using 90 D lens and indirect ophthalmoscope using 20D lens with scleral indentation with special care taken to identify all DR changes.
- On confirming the diagnosis of NPDR as per the ETDRS diagnostic staging mentioned in the introduction, those patients who fulfilled the inclusion criteria were informed about the study. A written consent was taken from these patients to be included in the study following which they subsequently underwent the following investigations:
- SD-OCT examination- Each macular thickness map was divided into nine standard macular subfields, out of which only central 3.1 mm diameter of fovea is taken into consideration. The central subfield is defined as a central circular area that had a diameter of 1.2mm. A second circle with a diameter of 3.1mm is placed around the central circle. The central foveal thickness was noted.
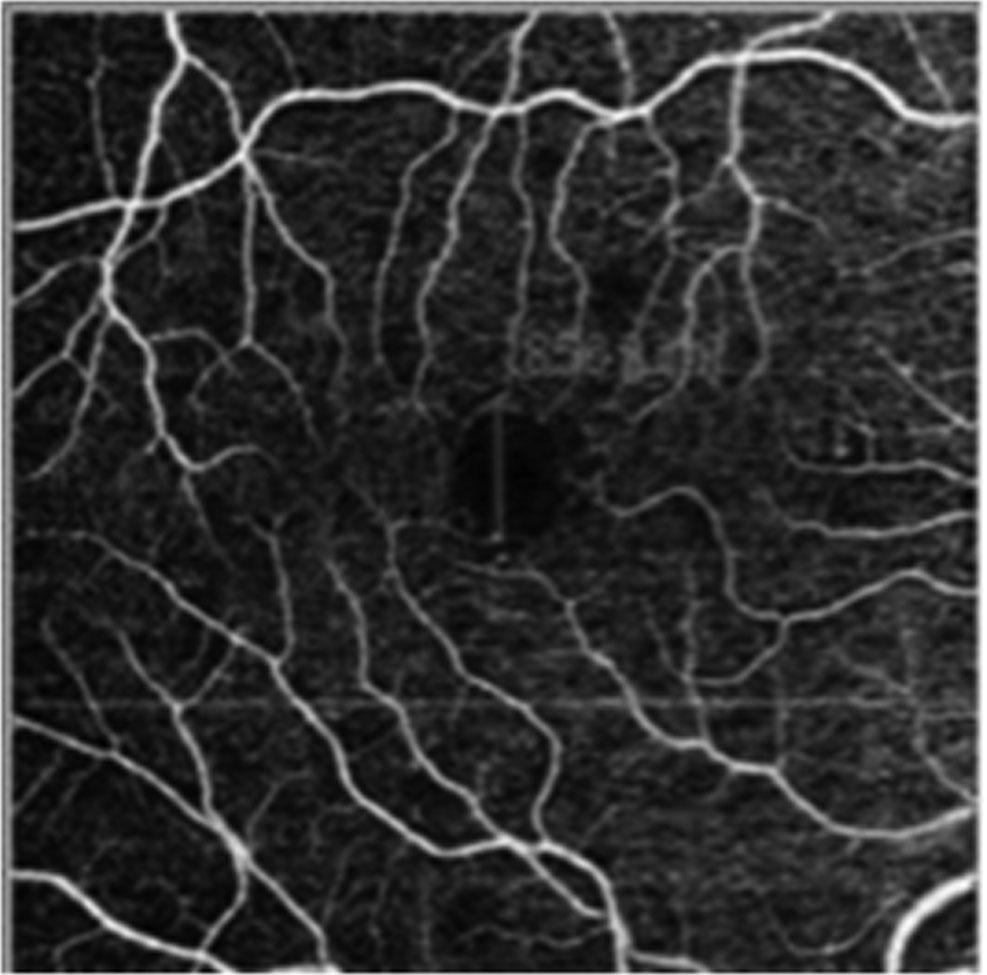
- OCT-A-The device (DRI OCT TRITON Plus) was used for obtaining OCT-A images. This device performs each acquisition at a speed of 100000 A-scans per second, using a 1050 nm super luminescent diode and with a bandwidth of 45 nm; 320 A-scans made up a B-scan while 320 horizontal and vertical lines separated by 9 mm each were sampled in the scanning area in order to form a 3-dimensional data cube of 6×6 mm area. Volumetric raster scans were obtained from 2 horizontal fast transverse scans and 2 vertical fast transverse scans acquired in 3.4 seconds each. The calculated amplitude de-correlation signal from the consecutive B-scans allowed visualization of blood flow, and therefore the capillary network, to be clearly visualized.
The following FAZ Characteristics were taken into consideration by two independent observers from OCT-A images of patients. FAZ area was marked manually whereas GLD MHD and MVD were calculated with the software’s caliper function.
- Greatest linear dimension (GLD)
- FAZ Area
- Maximum Horizontal diameter (MHD)
- Maximum Vertical diameter (MVD)
The means of the observed values were taken in our study.
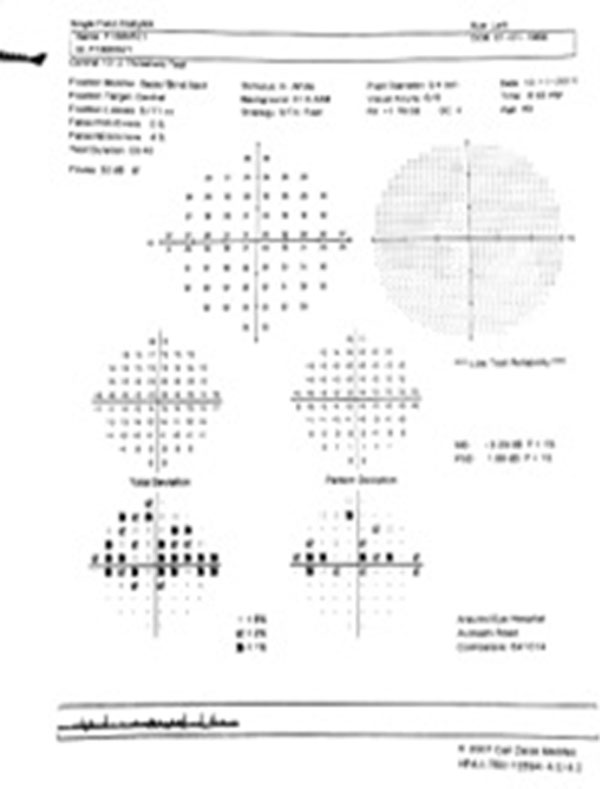
3.Humphrey visual field analyzer (Zeiss) was used to do a 10-2 field with 68 points covering the central 10 degrees. SITA standard programme was used for analysis. Reliability indices were followed. The mean defect (MD) is mean elevation or depression of overall field as compared to age-matched normal reference field. The pattern standard deviation (PSD) highlights any irregularity in the visual field, irrespective of the overall depression in the hill of vision. The severity of field defects based on the values of MD and PSD was correlated with the FAZ parameters.
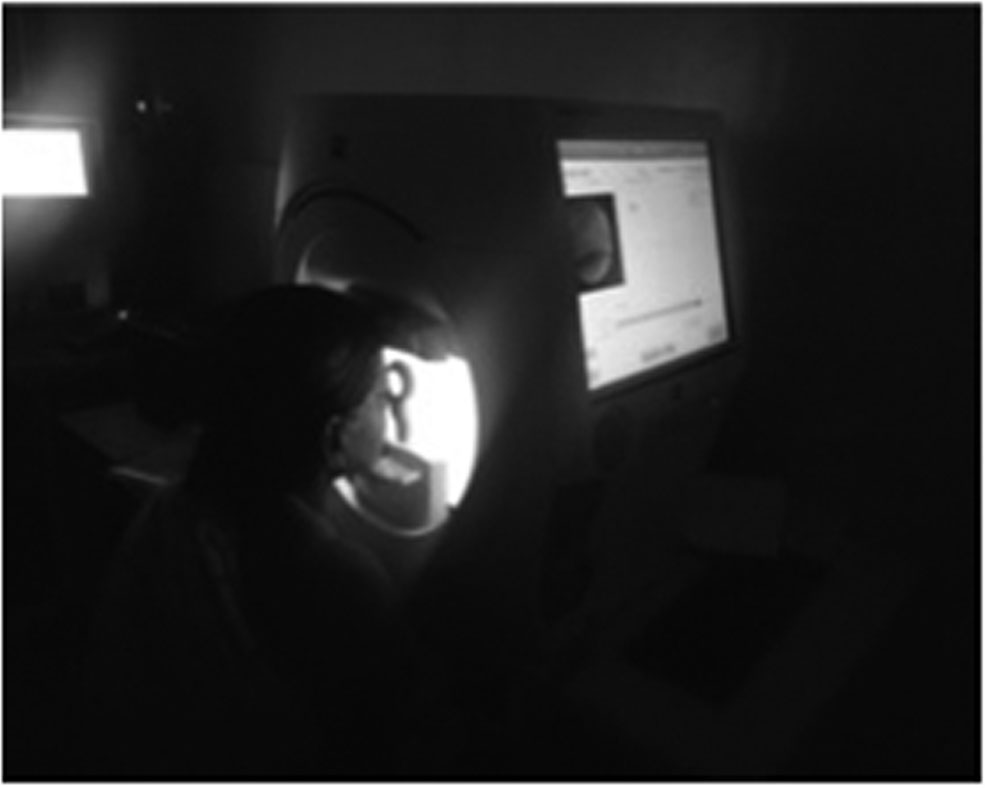
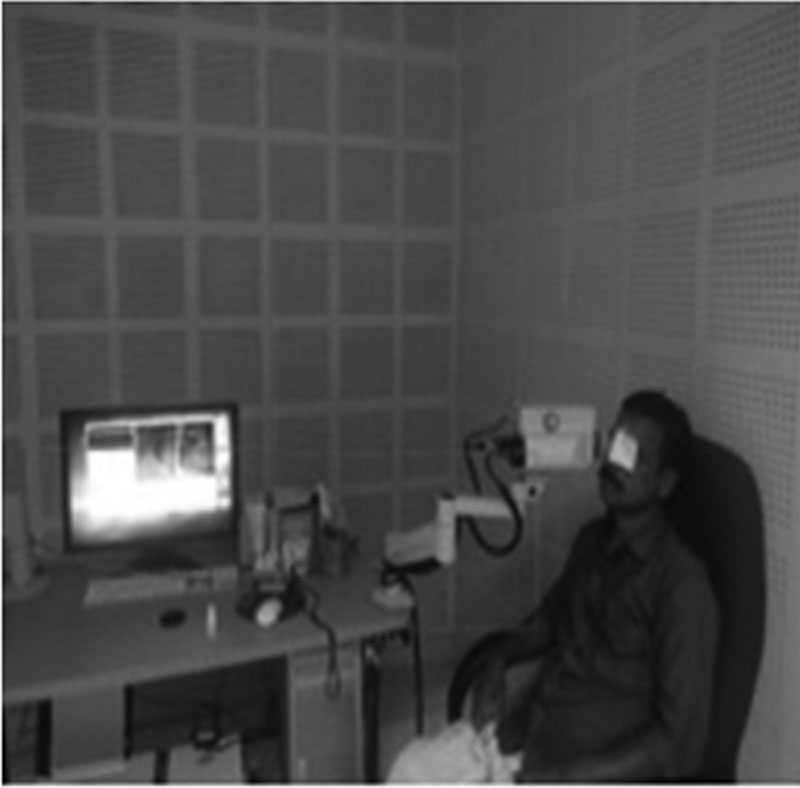
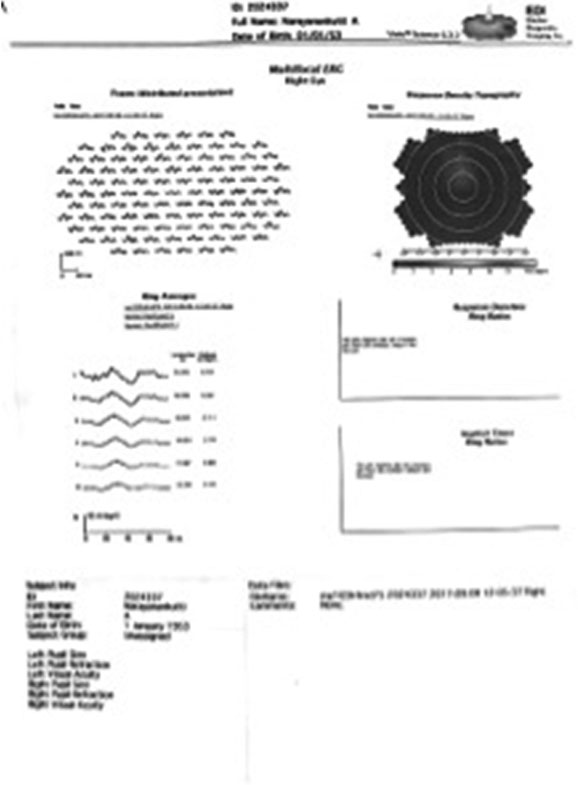
4.Multifocal ERG was be recorded (using VERIS FMSIII Stimulator) with scaled hexagons stimulating 61 zones. As per ISCEV guidelines , after pre test adaptation and full dilatation of the pupils with 1% tropicamide eyedrops, bipolar Burian Allen electrodes were applied. Recording was done after correcting the refractive error.
The first-order kernel responses were analyzed. P1 amplitude (measured from N1 trough to the P1 peak) and implicit time (from stimulus onset to P1 peak) was measured for central three rings . Ring 1 is responsible for (central 2o),Ring 2 (2 to 5o ) and Ring 3 (5 to 10o)representation of retina.
5.Blood tests were done and following values were noted:
o HbA1c
o Lipid Profile- Serum Cholesterol- Total, HDL, LDL
o Renal Profile- Serum urea, Serum creatinine.
8. STATISTICAL METHODS:
Mean (SD) and Frequency (percentage) was used for continuous and categorical variables respectively. Paired t-test was used to test mean difference between the two continuous variables. Independet t-test was used to find our significant difference between means of two unrelated groups. Analysis of variance (ANOVA) was used to assess the significant difference among two are more categories of independent variable over dependent variable. p value less than 0.05 was considered as statistically significant. All statistical analysis was done on statistical software SPSS 16.0.
RESULTS:
- Our study included a total of 57 participants with NPDR, of which 17 were below the age of 51, 24 were between 51-60 years and 16 were above 60 years of age. The mean age was 55.89 years. Of the study participants, 38 were male whereas 19 were female.
- Of the study participants, 36 had DM for less than 5 years, 17 for 5-8 years and 4 participants for more than 9 years. The mean duration of DM was 4.07 years.
- Of the total 57 participants, 19 each with mild, moderate and severe NPDR were recruited. 9 participants with moderate NPDR had CSME and 10 did not. 11 participants with severe NPDR had CSME and 8 did not. None of the participants with mild NPDR had CSME.
- Two independent observers measured the FAZ parameters on OCT-A. There was no statistically significant difference between the two readings as shown in table 1. Average values were thus taken into consideration.
- No correlation was noticed between FAZ area, GLD, MHD and MVD and the age & gender of participants. It was found that GLD (p= 0.046) and MHD (p=0.005)of the FAZ had a statistically significant increase in size with increasing severity of NPDR and MVD did not. FAZ area, though showing an increasing trend, was not found to have a statistically significant correlation with severity of NPDR.
- None of the FAZ parameters were found to have a significant relationship with the duration of DM. The FAZ area did not have a significant correlation with either best-corrected visual acuity or contrast sensitivity.
- No significant correlation was seen between FAZ parameters and other visual factors such as mfERG and 10-2 fields.
- Amongst systemic factors, GLD was seen to have a significant correlation with hyperlipidemia (p=0.011). FAZ area (p=0.002) and GLD (p=0.000) were both found to have a significant association with nephropathy.
- No significant correlation was observed between FAZ parameters and other systemic factors such as hypertension, glycemic control (HbA1c) and BMI.
DISCUSSION:
In our study we aimed at measuring the FAZ characteristics by OCT- A in patients with NPDR and correlating them with various visual function parameters such as best corrected visual acuity (BCVA), contrast sensitivity, multifocal electroretinogram (mfERG), 10-2 visual fields and also with various systemic factors. Patients with Diabetic Macular Ischemia (DMI) at baseline progressed aggressively into proliferative changes seen in Diabetic Retinopathy than those with normal perfusion as per RIDE and RISE trials (8). OCT-A is emerging as a new non-invasive imaging modality as compared to traditional FFA and is being used in studying the changes of Foveal Avascular Zone in various retinal vascular pathologies like Branch retinal vein occlusion (66), central retinal vein occlusion (CRVO) (67), Diabetic Macular Edema (DME) and is used subsequently for prognosticating, monitoring and planning treatment strategies for patients with these disorders.
Ours was a cross sectional study in which FAZ parameters, namely FAZ area, greatest linear diameter (GLD), maximum horizontal diameter (MHD) and maximum vertical diameter (MVD), were measured on OCT-A by two independent observers. No significant difference was found between the readings of the two observers.
We recruited at total of 57 participants in the study, 19 each with mild, moderate and sever NPDR. Of these, 17 were below the age of 51, 24 were between 51-60 years and 16 were above 60 years of age. 38 participants were male whereas 19 were female. Of the study participants, 36 had DM for less than 5 years, 17 for 5-8 years and 4 participants for more than 9 years. Age and gender were found not to be correlating with the FAZ parameters. This is in concordance with the study by J. CONRATH et al (63).
In a study conducted by HEMLATHA BC et al (62), it was found that FAZ area and diameter both show a strong correlation with the stage of NPDR. Other studies have also shown FAZ to be larger in moderate and severe NPDR and PDR as compared to non-diabetics. Our study showed the GLD to have a strong correlation with the stage on NPDR. FAZ area, in spite of showing a positive trend, was found not to have a significant correlation.
The duration of DM was not found to have any significant association with the FAZ area in studies by MM GOUDOT et al (68) and FANG YAO TANG et al (69). This is in agreement with the findings of our study.
The FAZ area was not found to be associated with best-corrected visual acuity in NPDR patients in our study. These findings are similar to the study by HEMLATHA BC et al (62). However, in studies, which included PDR patients as well, such as the ones by BALARATNASINGAM C et al (64) and SAMARA et al (55), a significant association was observed. The central foveal thickness (FT) however was found to have a significant association with the BCVA. A study by ISLAM F et al (70) showed a moderate correlation (p< 0.001) between FT and visual acuity in patients with diabetic macular edema.
In a study by O. AREND et al (71), it was found that with increasing size of FAZ the contrast sensitivity decreased significantly (p= 0.005). This study had included early diabetics without CSME. However in our study, though FAZ showed a negative correlation with contrast sensitivity, it was not found to be statistically significant.
TYRBERG et al. assessed the function of central retina in 25 diabetics with enlarged FAZ. Significant correlation was found between increasing FAZ diameter and increasing implicit time of the innermost concentric ring and the third concentric ring in the first order kernel of mfERG (61). No such correlation between FAZ, GLD and P1 implicit time was found in our study. Ischemic areas and mfERG amplitudes were seen to have no correlation, which is in concordance with our study.
In our study, P1 latency in the three innermost rings of mfERG was seen to have a significant positive correlation with the FT. The amplitudes of the second and third concentric rings was seen to correlate negatively with increasing FT. Similarly, in a study by K OKADA et al, it was found that an increasing macular thickness in the central area of OCT correlated to reduced amplitude (p=0.004) and prolonged latencies (p=0.004) in the innermost 2 rings of mfERG (72).
The FAZ area was not found to have a correlation with the MD and PSD values on 10-2 field. This is similar to the findings of a study by B. BENGTSSON et al, where FAZ alone did not correlate with the MD in central 6-degree field (60). However, according to this study, when perifoveal intercapillary areas were taken into consideration with the FAZ, a significant association was found.
In our study, 39 of the participants were hypertensive whereas 18 were not. No significant difference was found between the two groups in FAZ area and GLD. These findings are similar to those of the studies conducted by D. SHUKLA et al (65) and O. AREND et al (71) where no association was found between macular ischemia and hypertension.
In a study conducted by J. CONRATH et al (63) in 110 diabetic eyes, it was found that total cholesterol levels do not have a significant correlation with FAZ. However, Apo A1 fraction might have a protective tendency on macular vascularization. Similarly, in studies conducted by D. SHUKLA et al (65) and HEMLATHA BC et al (62), no significant association was found between hyperlipidemia and macular ischemia. In our study, total cholesterol was <200 mg/dL (normal) in 21 participants, 200-239 mg/dL (borderline) in 13 and >240 mg/dL (high) in 23 participants. FAZ area was not found to be significantly correlating with hyperlipidemia. GLD was however found to have a significant correlation with hyperlipidemia. This is in concordance with the CURES study by M. REMA et al (75) .
In our study, abnormal serum creatinine levels of > 1.2 mg/dL were found in 27 out of the 57 participants. This alteration in the renal profile was found to be significantly associated with FAZ area, GLD as well as FT. These findings are similar to the studies by HEMLATHA BC et al (62) and D. SHUKLA et al (72), where macular ischemia was found to have a significant correlation with nephropathy.
Amongst the 57 participants in our study, 3 had an HbA1c of <6%, 40 between 6-8% and 14 above 8%. No significant association was found between FAZ size, GLD and worsening glycemic control. This is in concordance with the findings of studies conducted by AYSE GUL KOCAK et al (76) and J. CONRATH et al (63). However in the study by HEMLATHA BC et al (62) and SANDER et al, a positive association was found.
The BMI of 12 participants was found to be normal (<25), 38 participants were overweight with a BMI between 25-30 and 7 were obese with a BMI over 30. No significant correlation was found between FAZ parameters and BMI in our study. In the study by J. CONRATH et al, a negative correlation was found between FAZ area and BMI. (63).
CONCLUSION:
- Inter-observer variations in calculation of values of FAZ parameters are insignificant thereby showing the values of the various parameters calculated on OCT- A in the study are reproducible.
- FAZ parameters showed a positive correlation with increasing severity of NPDR and nephropathy. GLD showed a significant association with hyperlipidemia. However, no significant association was seen with visual acuity, contrast sensitivity, field, mfERG, glycemic control, hypertension and duration of diabetes.
- Macular ischemia thus might be a marker for severity of retinopathy as well as nephropathy. The presence of diabetic macular ischemia should prompt the need for further systemic evaluation.
- This may aid in the effective screening of maculopathy and nephropathy, thus reducing the ocular and systemic morbidity associated with diabetes.
REFERENCES:
- Gadkari SS, Maskati QB, Nayak BK. Prevalence of diabetic retinopathy in India: The All India Ophthalmological Society Diabetic Retinopathy Eye Screening Study 2014. Indian J Ophthalmol. 2016 Jan;64(1):38–44.
- Raman R, Gella L, Srinivasan S, Sharma T. Indian J Ophthalmol. 2016 Jan; 64(1):69-75.
- Chen MS, Kao CS, Chang CJ, Wu TJ, Fu CC, Chen CJ, et al. Prevalence and risk factors of diabetic retinopathy among noninsulin-dependent diabetic subjects. Am J Ophthalmol. 1992 Dec 15;114(6):723–30.
- Girach A, Lund-Andersen H. Diabetic macular oedema: a clinical overview. Int J ClinPract. 2007 Jan;61(1):88–97.
- Gardner TW, Larsen M, Girach A, Zhi X, Protein Kinase C Diabetic Retinopathy Study (PKC-DRS2) Study Group. Diabetic macular oedema and visual loss: relationship to location, severity and duration. ActaOphthalmol. 2009 Nov;87(7):709–13.
- Sakata K, Funatsu H, Harino S, Noma H, Hori S. Relationship of macular microcirculation and retinal thickness with visual acuity in diabetic macular edema. Ophthalmology. 2007 Nov;114(11):2061–9.
- Sim DA, Keane PA, Zarranz-Ventura J, Bunce CV, Fruttiger M, Patel PJ, et al. Predictive factors for the progression of diabetic macular ischemia. Am J Ophthalmol. 2013 Oct;156(4):684–92.
- Domalpally A, Ip MS, Ehrlich JS. Effects of intravitreal ranibizumab on retinal hard exudate in diabetic macular edema: findings from the RIDE and RISE phase III clinical trials. Ophthalmology. 2015 Apr 1;122(4):779-86.
- Bresnick GH, Condit R, Syrjala S, Palta M, Groo A, Korth K. Abnormalities of the foveal avascular zone in diabetic retinopathy. Arch Ophthalmol. 1984 Sep;102(9):1286–93.
- Arend O, Wolf S, Jung F, Bertram B, Pöstgens H, Toonen H, et al. Retinal microcirculation in patients with diabetes mellitus: dynamic and morphological analysis of perifoveal capillary network. Br J Ophthalmol. 1991 Sep;75(9):514–8.
- Mansour AM, Schachat A, Bodiford G, Haymond R. Foveal avascular zone in diabetes mellitus. Retina (Philadelphia, Pa). 1993;13(2):125–8.
- Conrath J, Giorgi R, Raccah D, Ridings B. Foveal avascular zone in diabetic retinopathy: quantitative vs qualitative assessment. Eye (Lond). 2005 Mar;19(3):322–6.
- Nelson DA, Burgansky-Eliash Z, Barash H, Loewenstein A, Barak A, Bartov E, et al. High-resolution wide-field imaging of perfused capillaries without the use of contrast agent. ClinOphthalmol. 2011;5:1095–106.
- Tam J, Dhamdhere KP, Tiruveedhula P, Manzanera S, Barez S, Bearse MA, et al. Disruption of the retinal parafoveal capillary network in type 2 diabetes before the onset of diabetic retinopathy. Invest Ophthalmol Vis Sci. 2011 Nov;52(12):9257–66.
- Kim DY, Fingler J, Zawadzki RJ, Park SS, Morse LS, Schwartz DM, et al. Noninvasive imaging of the foveal avascular zone with high-speed, phase-variance optical coherence tomography. Invest Ophthalmol Vis Sci. 2012 Jan;53(1):85–92.
- Tam J, Dhamdhere KP, Tiruveedhula P, Lujan BJ, Johnson RN, Bearse MA, et al. Subclinical capillary changes in non-proliferative diabetic retinopathy. Optom Vis Sci. 2012 May;89(5):E692-703.
- Wilkinson, C. P., et al. “Proposed international clinical diabetic retinopathy and diabetic macular edema disease severity scales.” Ophthalmology 110.9 (2003): 1677-1682
- Spaide RF, Klancnik JM, Cooney MJ. Retinal vascular layers imaged by fluorescein angiography and optical coherence tomography angiography. JAMA Ophthalmol. 2015 Jan;133(1):45–50.
- Mariampillai A, Standish BA, Moriyama EH, Khurana M, Munce NR, Leung MK, et al. Speckle variance detection of microvasculature using swept-source optical coherence tomography. Opt Lett. 2008 Jul 1;33(13):1530–2.
- Enfield J, Jonathan E, Leahy M. In vivo imaging of the microcirculation of the volar forearm using correlation mapping optical coherence tomography (cmOCT). Biomed Opt Express. 2011 Apr 13;2(5):1184–93.
- Chui TYP, Vannasdale DA, Burns SA. The use of forward scatter to improve retinal vascular imaging with an adaptive optics scanning laser ophthalmoscope. Biomed Opt Express. 2012 Oct 1;3(10):2537–49.
- Jia Y, Tan O, Tokayer J, Potsaid B, Wang Y, Liu JJ, et al. Split-spectrum amplitude-decorrelation angiography with optical coherence tomography. Opt Express. 2012 Feb 13;20(4):4710–25.
- Miura M, Makita S, Iwasaki T, Yasuno Y. Three-dimensional visualization of ocular vascular pathology by optical coherence angiography in vivo. Invest Ophthalmol Vis Sci. 2011 Apr;52(5):2689–95.
- Jia Y, Bailey ST, Wilson DJ, Tan O, Klein ML, Flaxel CJ, et al. Quantitative optical coherence tomography angiography of choroidal neovascularization in age-related macular degeneration. Ophthalmology. 2014 Jul;121(7):1435–44.
- Sokol, Samuel, et al. “Contrast sensitivity in diabetics with and without background retinopathy.” Archives of ophthalmology 1 (1985): 51-‐ 54.
- Han, Ying, et al. “Multifocal Electroretinogram and Short-‐Wavelength Automated Perimetry Measures in Diabetic Eyes With Little or No Retinopathy.” Archives of ophthalmology 12 (2004): 1809-‐1815.
- World Health Organization. Global report on diabetes. World Health Organization; 2016.
- Rema M, Premkumar S, Anitha B, Deepa R, Pradeepa R, Mohan V. Prevalence of diabetic retinopathy in urban India: the Chennai Urban Rural Epidemiology Study (CURES) eye study, I. Investigative ophthalmology & visual science. 2005 Jul 1;46(7):2328-33.
- Narendran V, John RK, Raghuram A, Ravindran RD, Nirmalan PK, Thulasiraj RD. Diabetic retinopathy among self reported diabetics in southern India: a population based assessment. British journal of ophthalmology. 2002 Sep 1;86(9):1014-8.
- Namperumalsamy P, Kim R, Vignesh TP, Nithya N, Royes J, Gijo T, Thulasiraj RD, Vijayakumar V. Prevalence and risk factors for diabetic retinopathy: a population-based assessment from Theni District, south India. Postgraduate medical journal. 2009 Dec 1;85(1010):643-8.
- Raman R, Ganesan S, Pal SS, Kulothungan V, Sharma T. Prevalence and risk factors for diabetic retinopathy in rural India. SankaraNethralaya Diabetic Retinopathy Epidemiology and Molecular Genetic Study III (SN-DREAMS III), report no 2. BMJ Open Diabetes Research and Care. 2014 Jun 1;2(1):e000005.
- Early Treatment Diabetic Retinopathy Study Research Group. Grading diabetic retinopathy from stereoscopic color fundus photographs—an extension of the modified Airlie House classification: ETDRS report number 10. Ophthalmology. 1991 May 1;98(5):786-806.
- Tick S, Rossant F, Ghorbel I, Gaudric A, Sahel J-A, Chaumet-Riffaud P, et al. Foveal shape and structure in a normal population. Invest Ophthalmol Vis Sci. 2011 Jul 29;52(8):5105–10.
- Snodderly DM, Weinhaus RS, Choi JC. Neural-vascular relationships in central retina of macaque monkeys (Macacafascicularis). J Neurosci. 1992 Apr;12(4):1169–93.
- Cogan DG, Toussaint D, Kuwabara T. Retinal vascular patterns. IV. Diabetic retinopathy. Arch Ophthalmol. 1961 Sep;66:366–78.
- Kuwabara T, Cogan DG. Studies of retinal vascular patterns. I. Normal architecture. Arch Ophthalmol. 1960 Dec;64:904–11.
- Akagi Y, Kador PF, Kuwabara T, Kinoshita JH. Aldose reductase localization in human retinal mural cells. Invest Ophthalmol Vis Sci. 1983 Nov;24(11):1516–9.
- Brownlee M. Biochemistry and molecular cell biology of diabetic complications. Nature. 2001 Dec 13;414(6865):813–20.
- Barrett TB, Gajdusek CM, Schwartz SM, McDougall JK, Benditt EP. Expression of the sis gene by endothelial cells in culture and in vivo. ProcNatlAcadSci USA. 1984 Nov;81(21):6772–4.
- Collins T, Ginsburg D, Boss JM, Orkin SH, Pober JS. Cultured human endothelial cells express platelet-derived growth factor B chain: cDNA cloning and structural analysis. Nature. 1985 Aug 22;316(6030):748–50.
- Collins T, Pober JS, Gimbrone MA, Hammacher A, Betsholtz C, Westermark B, et al. Cultured human endothelial cells express platelet-derived growth factor A chain. Am J Pathol. 1987 Jan;126(1):7–12.
- DiCorleto PE, Bowen-Pope DF. Cultured endothelial cells produce a platelet-derived growth factor-like protein. ProcNatlAcadSci USA. 1983 Apr;80(7):1919–23.
- Yannuzzi LA, Rohrer KT, Tindel LJ, Sobel RS, Costanza MA, Shields W, et al. Fluorescein angiography complication survey. Ophthalmology. 1986 May;93(5):611–7.
- Bernstein LR, Antoniades H, Zetter BR. Migration of cultured vascular cells in response to plasma and platelet-derived factors. J Cell Sci. 1982 Aug;56:71–82.
- D’Amore PA, Smith SR. Growth factor effects on cells of the vascular wall: a survey. Growth Factors. 1993;8(1):61–75.
- Yamana Y, Oka Y, Ohnishi Y, Ishibashi T, Inoguchi T. Reflow of obstructed capillaries in the maculae of humans with diabetic retinopathy, observed by fluorescein angiography. Br J Ophthalmol. 1988 Sep;72(9):660–5.
- McLeod DS, Lefer DJ, Merges C, Lutty GA. Enhanced expression of intracellular adhesion molecule-1 and P-selectin in the diabetic human retina and choroid. Am J Pathol. 1995 Sep;147(3):642–53.
- Miyamoto K, Khosrof S, Bursell SE, Rohan R, Murata T, Clermont AC, et al. Prevention of leukostasis and vascular leakage in streptozotocin-induced diabetic retinopathy via intercellular adhesion molecule-1 inhibition. ProcNatlAcadSci USA. 1999 Sep 14;96(19):10836–41.
- Grillo LM, Wang DL, Ramachandran R, Ehrlich AC, De Moraes CG, Ritch R, Hood DC. The 24-2 visual field test misses central macular damage confirmed by the 10-2 visual field test and optical coherence tomography. Translational vision science & technology. 2016 Mar 1;5(2):15-.
- Hood DC, Bach M, Brigell M, Keating D, Kondo M, Lyons JS, Marmor MF, McCulloch DL, Palmowski-Wolfe AM, International Society For Clinical Electrophysiology of Vision. ISCEV standard for clinical multifocal electroretinography (mfERG)(2011 edition). DocumentaOphthalmologica. 2012 Feb 1;124(1):1-3.
- Diabetic Retinopathy Clinical Research Network. Three-year follow up of a randomized trial comparing focal/grid photocoagulation and intravitreal triamcinolone for diabetic macular edema. Archives of ophthalmology. 2009 Mar;127(3):245.
- Oluleye TS. Current Management of Diabetic Maculopathy. J Diabetes Metab S. 2011;3:2.
- Saxena S, Jalali S, Meredith TA, Holekamp NM, Kumar D. Management of diabetic retinopathy. Indian journal of ophthalmology. 2000 Dec 1;48(4):321.
- Fadda V, Maratea D, Trippoli S, Messori A. Treatments for macular degeneration: summarising evidence using network meta-analysis. British Journal of Ophthalmology. 2011 Oct 1;95(10):1476-7.
- Samara, Wasim A., et al. “Correlation of foveal avascular zone size with foveal morphology in normal eyes using optical coherence tomography angiography.” Retina 11 (2015): 2188-2195.
- Samara, Wasim A., et al. “Quantification of diabetic macular ischemia using optical coherence tomography angiography and its relationship with visual acuity.” Ophthalmology 2 (2017): 235-244.
- Takase, Noriaki, et al. “Enlargement of foveal avascular zone in diabetic eyes evaluated by en face optical coherence tomography angiography.” Retina 11 (2015): 2377-2383.
- Stavrou, Efty P., and Joanne M. Wood. “Letter contrast sensitivity changes in early diabetic retinopathy.” Clinical and Experimental Optometry 3 (2003): 152-156.
- Haymes, Sharon A., et al. “The letter contrast sensitivity test: clinical evaluation of a new design.” Investigative ophthalmology & visual science 6 (2006): 2739-‐2745
- Bengtsson, B., Anders Heijl, and ElisabetAgardh. “Visual fields correlate better than visual acuity to severity of diabetic retinopathy.” Diabetologia 12 (2005): 2494-2500.
- Tyrberg, Maria, VesnaPonjavic, and Monica Lövestam-Adrian. “Multifocal electroretinogram (mfERG) in patients with diabetes mellitus and an enlarged foveal avascular zone (FAZ).” Documentaophthalmologica 3 (2008): 185-189.
- Hemalatha B C, SathyendranathShetty B ‘Analysis of foveal avascular zone in different stages of non/proliferative diabetic retinopathy at a tertiary eye care hospital’ Page No. 202-217
- Conrath J, Giorgi R, Ridings B, Raccah D. Metabolic factors and the foveal avascular zone of the retina in diabetes mellitus. Diabetes & metabolism. 2005 Nov 1;31(5):465-70.
- Suzuki N, Hirano Y, Yoshida M, Tomiyasu T, Uemura A, Yasukawa T, et al. Microvascular Abnormalities on Optical Coherence Tomography Angiography in Macular Edema Associated With Branch Retinal Vein Occlusion. Am J Ophthalmol. 2016 Jan;161:126–132.e1.
- Coscas F, Glacet-Bernard A, Miere A, Caillaux V, Uzzan J, Lupidi M, et al. Optical Coherence Tomography Angiography in Retinal Vein Occlusion: Evaluation of Superficial and Deep Capillary Plexa. Am J Ophthalmol. 2016 Jan;161:160-171.e1-2.
- Goudot MM, Sikorav A, Semoun O, et al. Parafoveal OCT Angiography Features in Diabetic Patients without Clinical Diabetic Retinopathy: A Qualitative and Quantitative Error! Hyperlink reference not valid.of Ophthalmology. 2017;2017:8676091. doi:1155/2017/8676091.
- Tang FY, Ng DS, Lam A, Luk F, Wong R, Chan C, Mohamed S, Fong A, Lok J, Tso T, Lai F. Determinants of Quantitative Optical Coherence Tomography Angiography Metrics in Patients with Diabetes. Scientific reports. 2017 May 31;7(1):2575.
- Balaratnasingam C, Inoue M, Ahn S, McCann J, Dhrami-Gavazi E, Yannuzzi LA, Freund KB. Visual acuity is correlated with the area of the foveal avascular zone in diabetic retinopathy and retinal vein occlusion. Ophthalmology. 2016 Nov 1;123(11):2352-67.
- Islam F, Ashraf M, Zafar S, Masood H, Qureshi N. Retinal Thickness and Visual Acuity in Diabetic Macular Edema: An Optical Coherence Tomography-Based Study. Journal of the College of Physicians and Surgeons Pakistan. 2016 Jul 1;26(7):598-601.
- Arend O, Remky A, Evans D, Stüber R, Harris A. Contrast sensitivity loss is coupled with capillary dropout in patients with diabetes. Investigative ophthalmology & visual science. 1997 Aug 1;38(9):1819-24.
- Okada K, Yamamoto S, Mizunoya S, Hoshino A, Arai M, Takatsuna Y. Correlation of retinal sensitivity measured with fundus-related microperimetry to visual acuity and retinal thickness in eyes with diabetic macular edema. Eye. 2006 Jul;20(7):805.
- Shukla D, Kolluru CM, Singh J, John RK, Soman M, Gandhi B, Kim R, Perumalsamy N. Macular ischaemia as a marker for nephropathy in diabetic retinopathy. Indian journal of ophthalmology. 2004 Sep 1;52(3):205.
- Arend O, Rüffer M, Remky A. Macular circulation in patients with diabetes mellitus with and without arterial hypertension. British Journal of Ophthalmology. 2000 Dec 1;84(12):1392-6.
- Asefzadeh B, Fisch BM, Parenteau CE, Cavallerano AA. Macular thickness and systemic markers for diabetes in individuals with no or mild diabetic retinopathy. Clinical & experimental ophthalmology. 2008 Jul 1;36(5):455-63.
- Rema M, Srivastava BK, Anitha B, Deepa R, Mohan V. Association of serum lipids with diabetic retinopathy in urban South Indians—the Chennai Urban Rural Epidemiology Study (CURES) Eye Study—2. Diabetic medicine. 2006 Sep 1;23(9):1029-36.
- AyseGulKocakAltintas*, Mehmet Citirik and BayramGulpamuk. Relationship of Serum HbA1c and Fasting Serum Lipids with Central Macular Thickness in Patients with Type 2 Diabetes Mellitus
- Sng CC, Cheung CY, Man RE, Wong W, Sriram P, Lavanya R, Mitchell P, Tin A, Wong TY. Macular Thickness Between Persons With and Without Diabetes Measured From Optical Coherence Tomography: The Singapore Indian Eye Study (SINES). Investigative Ophthalmology & Visual Science. 2010 Apr 17;51(13):5048.
TABLES:
1) Table showing Inter-observer comparison of FAZ parameters on OCT-A:
| Mean | N | Std. Deviation | p value | ||
| Pair 1 | GLD 1 | 826.3860 | 57 | 117.11880 | 0.887 |
| GLD 2 | 826.7193 | 57 | 114.40323 | ||
| Pair 2 | MHD 1 | 771.4912 | 57 | 113.41267 | 0.59 |
| MHD 2 | 775.8421 | 57 | 118.53101 | ||
| Pair 3 | MVD 1 | 553.5263 | 57 | 134.69212 | 0.510 |
| MVD 2 | 555.2632 | 57 | 134.26154 | ||
| Pair 4 | FAZ AREA 1 | 380.8849 | 57 | 133.48621 | 0.934 |
| FAZ AREA 2 | 380.7233 | 57 | 132.33079 | ||
2)Table showing the mean values of averages of FAZ Parameters:
| Mean | SD | |
| FAZ AREA AV | 380.8 | 132.71 |
| GLD AV | 826.55 | 115.43 |
| MHD AV | 773.6 | 115.69 |
| MVD AV | 554.39 | 134.11 |
Mean FAZ area was 380.8 micrometer, GLD 826.55 micrometer, MHD 773.6 micrometer and MVD 554.39 micrometer.
ANALYSIS OF VARIANCE:
3) Table showing correlation of FAZ parameters with age by ANOVA test:
| Age Group | N | Mean | SD | p-value | |
| GLD AV | Below 51 yrs | 17 | 833.03 | 144.45 | 0.964 |
| 51 – 60 yrs | 24 | 823.67 | 99.64 | ||
| Above 60 yrs | 16 | 824.00 | 110.44 | ||
| MHD AV | Below 51 yrs | 17 | 783.71 | 155.55 | 0.696 |
| 51 – 60 yrs | 24 | 780.60 | 86.28 | ||
| Above 60 yrs | 16 | 752.59 | 109.90 | ||
| MVD AV | Below 51 yrs | 17 | 560.94 | 155.21 | 0.962 |
| 51 – 60 yrs | 24 | 554.25 | 125.03 | ||
| Above 60 yrs | 16 | 547.66 | 131.85 | ||
| FAZ AREA AV | Below 51 yrs | 17 | 379.66 | 150.13 | 0.940 |
| 51 – 60 yrs | 24 | 375.19 | 119.08 | ||
| Above 60 yrs | 16 | 390.44 | 140.75 |
4) Tables showing correlation of FAZ parameters with gender:
| Sex | N | Mean | SD | p-value | |
| GLD AV | Male | 38 | 834.26 | 129.60 | 0.481 |
| Female | 19 | 811.13 | 80.94 | ||
| MHD AV | Male | 38 | 779.20 | 123.25 | 0.614 |
| Female | 19 | 762.61 | 101.09 | ||
| MVD AV | Male | 38 | 553.36 | 140.70 | 0.935 |
| Female | 19 | 556.47 | 123.53 | ||
| FAZ AREA AV | Male | 38 | 398.93 | 157.62 | 0.146 |
| Female | 19 | 344.54 | 40.51 |
5) Table showing correlation of FAZ parameters with stage of NPDR:
| NPDR | N | Mean | SD | P-VALUE | |
| FAZ AREA AV | Mild | 19 | 349.10 | 50.11 | 0.299 |
| Moderate | 19 | 377.17 | 130.28 | ||
| Severe | 19 | 416.14 | 181.42 | ||
| Total | 57 | 380.80 | 132.71 | ||
| GLD AV | Mild | 19 | 786.71 | 68.93 | 0.046 |
| Moderate | 19 | 816.03 | 110.90 | ||
| Severe | 19 | 876.92 | 141.18 | ||
| Total | 57 | 826.55 | 115.43 | ||
| MHD AV | Mild | 19 | 713.05 | 79.79 | 0.005 |
| Moderate | 19 | 777.16 | 116.24 | ||
| Severe | 19 | 830.79 | 120.10 | ||
| Total | 57 | 773.67 | 115.69 | ||
| MVD AV | Mild | 19 | 516.97 | 84.49 | 0.053 |
| Moderate | 19 | 532.05 | 116.50 | ||
| Severe | 19 | 614.16 | 171.67 | ||
| Total | 57 | 554.39 | 134.11 |
6) Table showing correlation of FAZ parameters with duration of DM:
| Duration of DM | N | Mean | SD | P-VALUE | |
| FAZ AREA AV | < 5 years | 36 | 383.67 | 133.18 | 0.322 |
| 5 – 8 years | 17 | 354.78 | 48.19 | ||
| 9 – 12 years | 4 | 465.61 | 309.70 | ||
| Total | 57 | 380.80 | 132.71 | ||
| GLD AV | < 5 years | 36 | 822.36 | 105.98 | 0.311 |
| 5 – 8 years | 17 | 815.44 | 68.90 | ||
| 9 – 12 years | 4 | 911.50 | 286.07 | ||
| Total | 57 | 826.55 | 115.43 | ||
| MHD AV | < 5 years | 36 | 766.57 | 118.44 | 0.625 |
| 5 – 8 years | 17 | 776.35 | 83.81 | ||
| 9 – 12 years | 4 | 826.13 | 210.67 | ||
| Total | 57 | 773.67 | 115.69 | ||
| MVD AV | < 5 years | 36 | 551.04 | 120.86 | 0.354 |
| 5 – 8 years | 17 | 539.79 | 96.39 | ||
| 9 – 12 years | 4 | 646.63 | 321.08 | ||
| Total | 57 | 554.39 | 134.11 |
7) Table showing correlation of FAZ area with visual acuity and contrast sensitivity:
The mean value of BCVA was 0.15, Contrast sensitivity 1.5 and FT was 281.95 microns.
| FAZ AREA AV | VA | ||
| FAZ AREA AV | Pearson Correlation | 1 | .099 |
| p-value | .464 | ||
| FAZ AREA AV | CS | ||
| FAZ AREA AV | Pearson Correlation | 1 | -.197 |
| p-value | .142 | ||
8) Table showing correlation with mfERG parameters:
| FAZ AREA AV | R1 P1 lat | R2 P1 lat | R3 P1 lat | |||||||
| FAZ AREA AV | Pearson Correlation | 1 | -.051 | -.124 | -.032 | |||||
| p-value | .706 | .358 | .814 | |||||||
| N | 57 | 57 | 57 | 57 | ||||||
| GLD AV | R1 P1 lat | R2 P1 lat | R3 P1 lat | |||||||
| GLD AV | Pearson Correlation | 1 | -.076 | -.193 | .003 | |||||
| p-value | .575 | .151 | .984 | |||||||
| N | 57 | 57 | 57 | 57 | ||||||
FAZ area and GLD were both found to have no significant correlation with the P1 latencies in the first three innermost rings R1, R2 and R3 of mfERG.
| FAZ AREA AV | R1 P1 amp | R2 P1 amp | R3 P1 amp | ||
| FAZ AREA AV | Pearson Correlation | 1 | -.008 | .079 | -.033 |
| p-value | .955 | .560 | .807 | ||
| N | 57 | 57 | 57 | 57 |
| GLD AV | R1 P1 amp | R2 P1 amp | R3 P1 amp | ||
| GLD AV | Pearson Correlation | 1 | -.036 | .030 | -.067 |
| p-value | .793 | .827 | .622 | ||
| N | 57 | 57 | 57 | 57 |
FAZ area and GLD were both found to have no significant correlation with the P1 amplitudes in the first three innermost rings R1, R2 and R3 of mfERG.
9) Table showing correlation with 10-2 field parameters:
| FAZ AREA AV | MD | ||
| FAZ AREA AV | Pearson Correlation | 1 | -.154 |
| p-value | .253 | ||
| N | 57 | 57 | |
| FAZ AREA AV | PSD | ||
| FAZ AREA AV | Pearson Correlation | 1 | .047 |
| p-value | .727 | ||
| N | 57 | 57 |
The mean value of MD was -3.99 and that of PSD was 1.99 in our study.
As seen above, FAZ area was not found to significantly correlate with the MD and PSD of 10-2 field.
10) Table showing correlation with hypertension:
| HT | N | Mean | Std. Deviation | P-VALUE | |
| FAZ AREA AV | Present | 39 | 376.6121 | 132.61451 | 0.729 |
| Absent | 18 | 389.8869 | 136.29160 | ||
| GLD AV | Present | 39 | 817.9359 | 100.78476 | 0.412 |
| Absent | 18 | 845.2222 | 143.69056 |
11) Table showing correlation with lipid profile:
| Lipid Profile | N | Mean | SD | P-VALUE | |
| FAZ AREA AV | Normal | 21 | 351.47 | 39.42 | 0.118 |
| Borderline | 13 | 350.11 | 56.32 | ||
| High | 23 | 424.94 | 195.63 | ||
| Total | 57 | 380.80 | 132.71 | ||
| GLD AV | Normal | 21 | 775.67 | 52.63 | 0.011 |
| Borderline | 13 | 818.69 | 80.53 | ||
| High | 23 | 877.46 | 150.48 | ||
| Total | 57 | 826.55 | 115.43 | ||
| Borderline | 13 | 271.38 | 83.35 |
21 participants had normal total cholesterol (<200mg/dL), 13 had borderline levels (200-239 mg/dL) and 23 had high levels (>239 mg/dL). GLD was found to significantly correlate with increasing lipid levels. FAZ area, though showing a positive trend, was not significantly correlating.
12) Table showing correlation with renal profile.
| Bld. Urea | N | Mean | Std. Deviation | P-VALUE | |
| FAZ AREA AV | Normal | 4 | 296.3512 | 28.27789 | 0.189 |
| Abnormal | 53 | 387.1779 | 135.38847 | ||
| GLD AV | Normal | 4 | 755.3750 | 22.25749 | 0.204 |
| Abnormal | 53 | 831.9245 | 117.90439 | ||
| Sr. creatinine | N | Mean | Std. Deviation | P-VALUE | |
| FAZ AREA AV | Normal | 30 | 331.4068 | 34.35463 | 0.002 |
| Abnormal | 27 | 435.6900 | 175.13479 | ||
| GLD AV | Normal | 30 | 777.3333 | 56.11677 | 0.000 |
| Abnormal | 27 | 881.2407 | 138.86971 |
4 of 57 participants had a normal blood urea level of <20 mg/dL whereas the rest had abnormal >20 mg/dL levels. 30 participants had a normal serum creatinine level of <1.2 mg/dL and 27 had a raised level of >1.2 mg/dL. FAZ area, all found to significantly correlate with serum creatinine levels.
13) Table showing correlation with glycemic control:
| HbA1c | N | Mean | SD | P-VALUE | |
| FAZ AREA AV | < 6 | 3 | 361.81 | 101.68 | 0.124 |
| 6-8 | 40 | 360.23 | 103.36 | ||
| > 8 | 14 | 443.65 | 191.26 | ||
| Total | 57 | 380.80 | 132.71 | ||
| GLD AV | < 6 | 3 | 827.00 | 118.23 | 0.12 |
| 6-8 | 40 | 807.43 | 119.99 | ||
| > 8 | 14 | 881.11 | 87.87 | ||
| Total | 57 | 826.55 | 115.43 |
14) Table showing correlation with BMI
| BMI | N | Mean | SD | P-VALUE | |
| FAZ AREA AV | Normal | 12 | 358.52 | 65.20 | 0.779 |
| Overweight | 38 | 389.25 | 157.05 | ||
| Obese | 7 | 373.14 | 54.43 | ||
| Total | 57 | 380.80 | 132.71 | ||
| GLD AV | Normal | 12 | 808.63 | 80.93 | 0.828 |
| Overweight | 38 | 830.18 | 131.10 | ||
| Obese | 7 | 837.57 | 74.09 | ||
| Total | 57 | 826.55 | 115.43 |
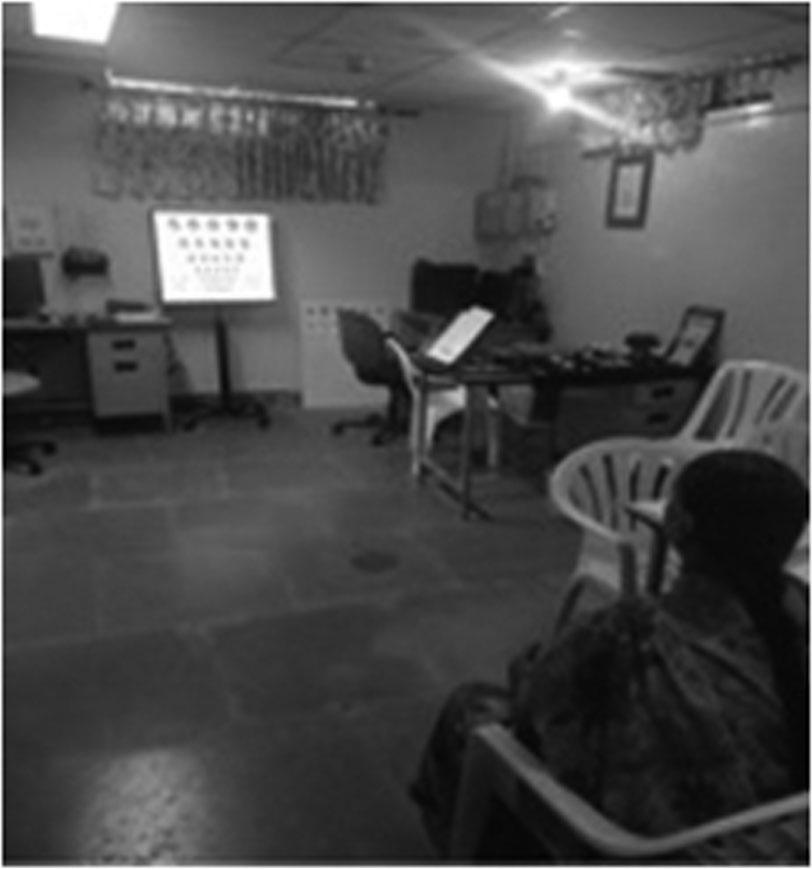

Figure 2: Mars Contrast Sensitivity chart
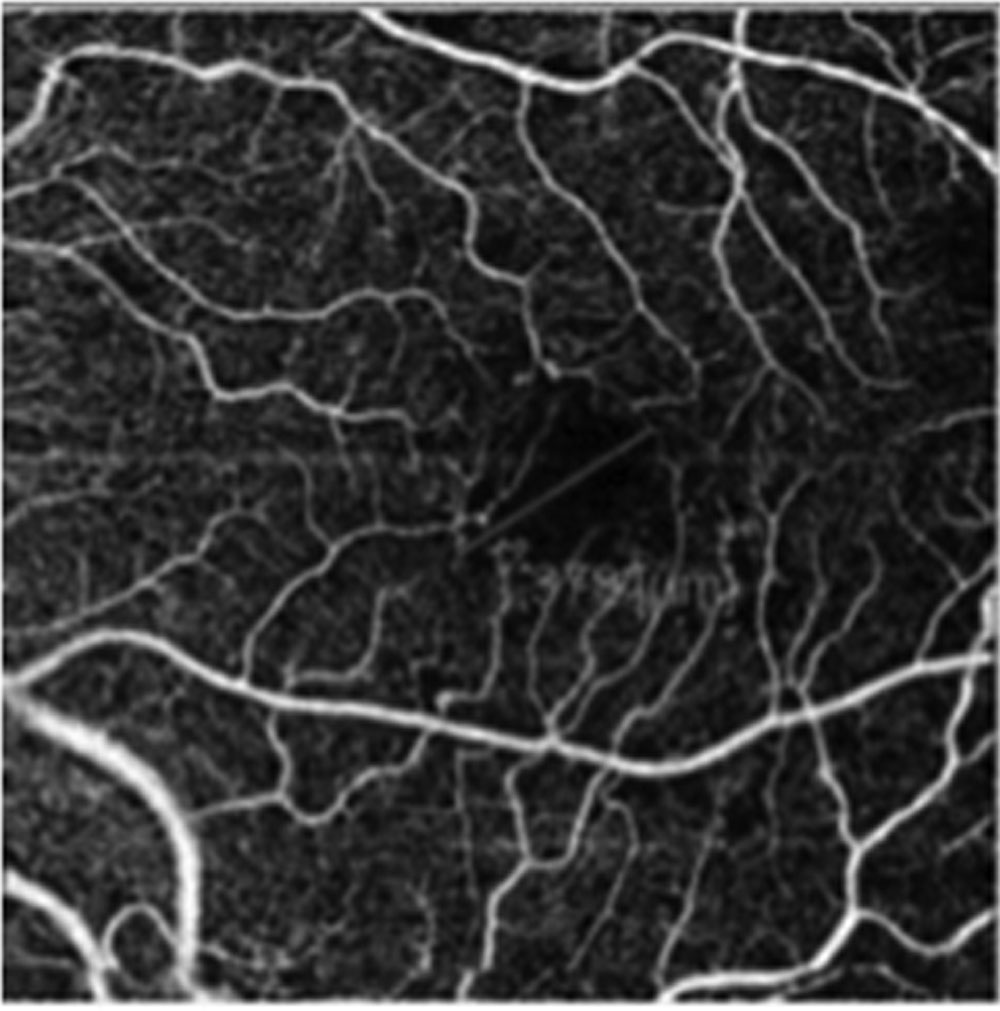
Figure 3: Showing GLD measurement by OCT-A
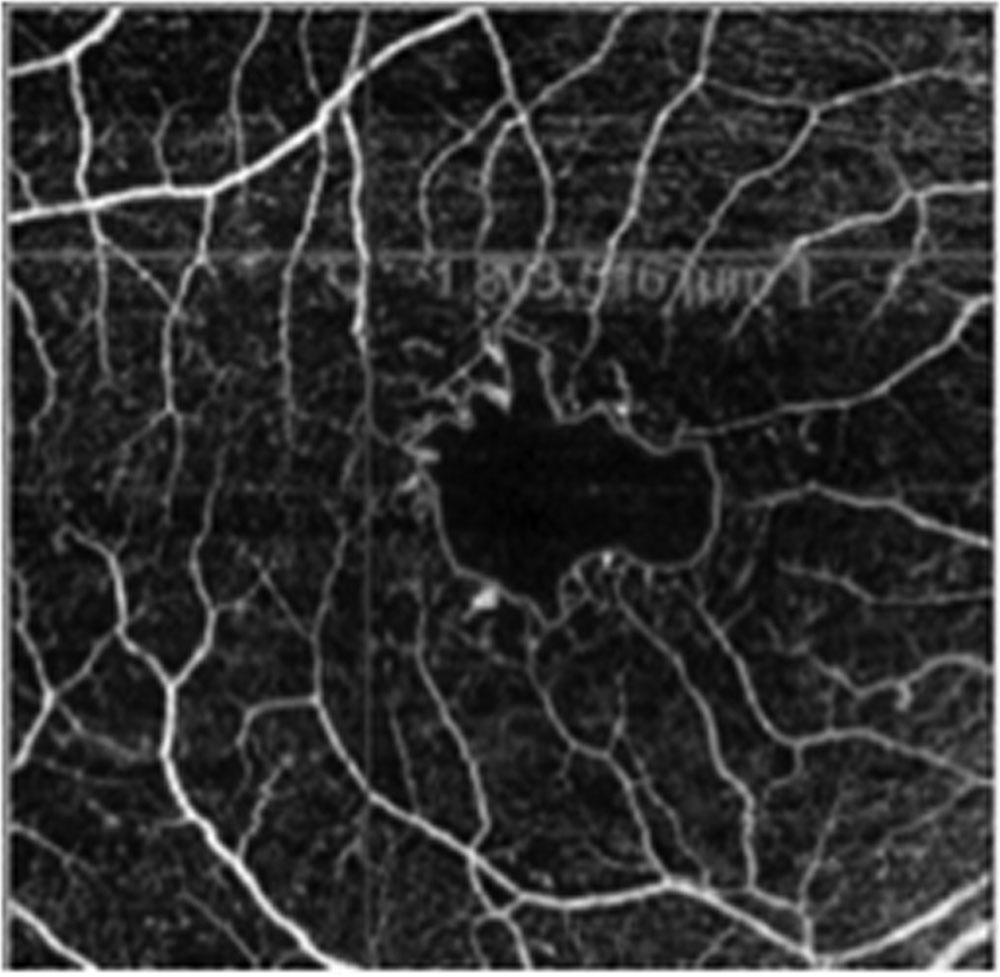
Figure 4: Showing FAZ area on OCT-A
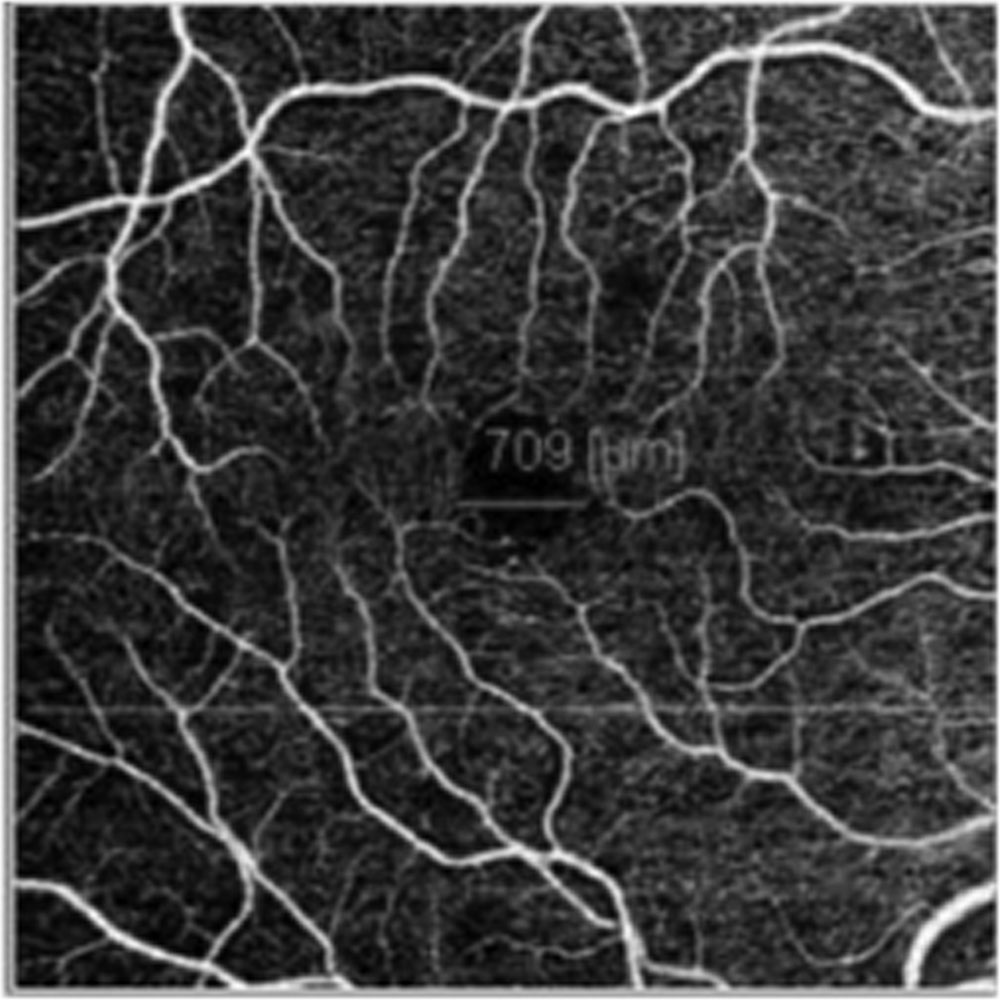
Figure 5: Showing MHD on OCT-A
Leave a Comment